Options Trade Monitor
Options Trade Monitor settings
Available settings
These settings affect only the selected Options Trade Monitor widget. To update the default settings with these value for newly-opened Options Trade Monitor widgets, or to apply them to existing opened widgets, click Defaults.
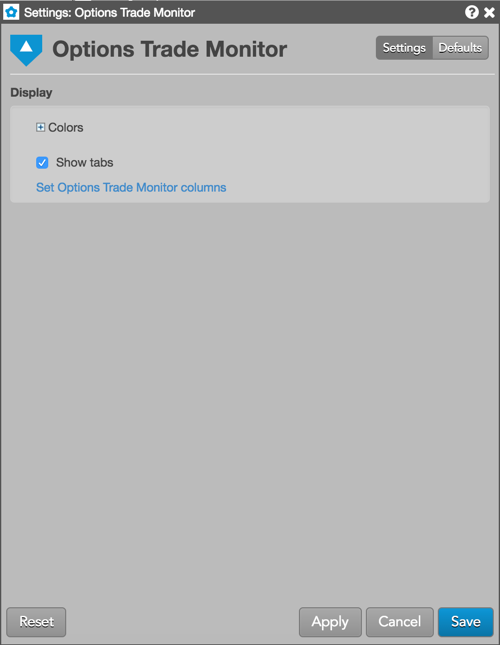
You can customize the Options Trade Monitor using the following settings:
-
Grid font size: Adjust the font size to suit your preferences and use bold text, if desired.
-
Colors: Allows you to customize or change the cell and column colors available in the widget.
-
Show tabs: Check to show tabs at the bottom of the widget. Uncheck to hide tabs.
-
Set Options Trade Monitor columns: Select the columns you want shown in the widget.
Options Trade Monitor column descriptions
| Column | Description |
|---|---|
| Date | Date the trade occurred |
| Time | Time the trade occurred |
| Instrument | The name and contract expiry for the instrument or strategy. |
| C/P | Whether the instrument is a call or put option. |
| Strike | Shows the underlying Futures contract price at which a holder can exercise their option to buy or sell the contract. The strike column reflects the range of the day by shading the strike. The high / low line indicators as seen on MD Trader® are displayed in the strike column relative to their position. |
| Type | The type of instrument or options strategy. |
| Qty | Shows the requested quantity if it's submitted with the RFQ for a contract. |
| Price | Price of the order or fill. |
| TV | The theoretical value of the instrument based on the user's volatility curve. |
| Edge | Edge gained (or lost) with the trade. |
| UndPx | Price of the underlying instrument. |
| IV | Implied volatility value. Implied volatilities are calculated using the midpoint of bid and ask prices. |
| IΔ | The delta calculated with the auto-fit volatility curve values provided by TT. |
| IGamma | Gamma calculated using implied volatility. |
| ITheta | Shows the change in options value per change in time, which is also known as time decay. Based on TT auto-fit volatility curve values. |
| IVega | Shows the change in options value per change in volatility based on the TT auto-fit volatility curve. |
| IRho | Shows the change in options value per change in interest rate. Based on TT auto-fit volatility curve values. |
| Volume | The total traded quantity for the session. |