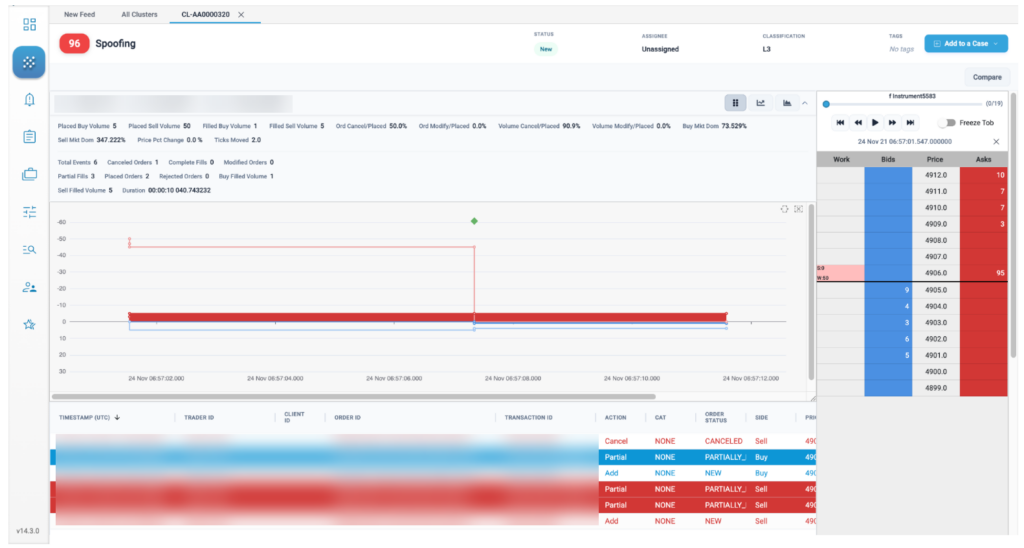
The Cluster Scorecard view provides a summary of the vital statistics of the cluster as well as an initial visualization of the pattern that was formed by the order and fill messages that comprised the cluster. You can also view the activity in the cluster in the context of the market data at the time.
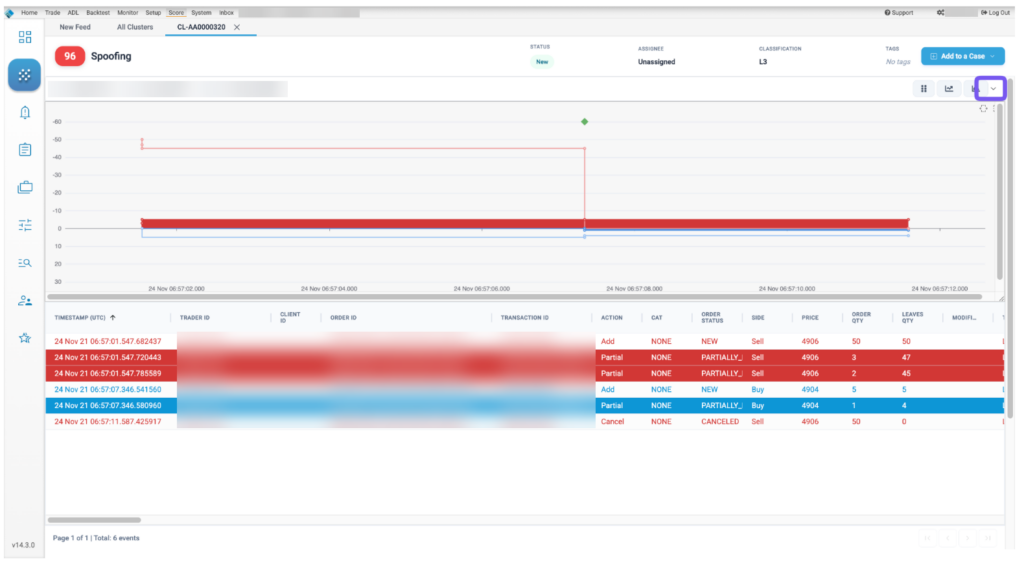
Clicking the expand button from the in-line review panel of Cluster List View opens the scorecard for the selected cluster:
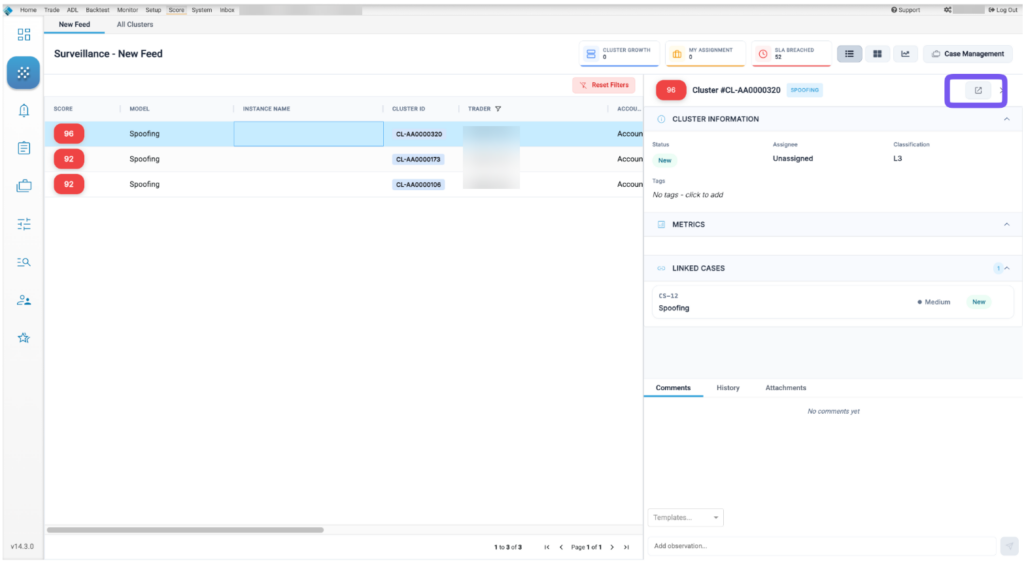
Cluster Scorecard display
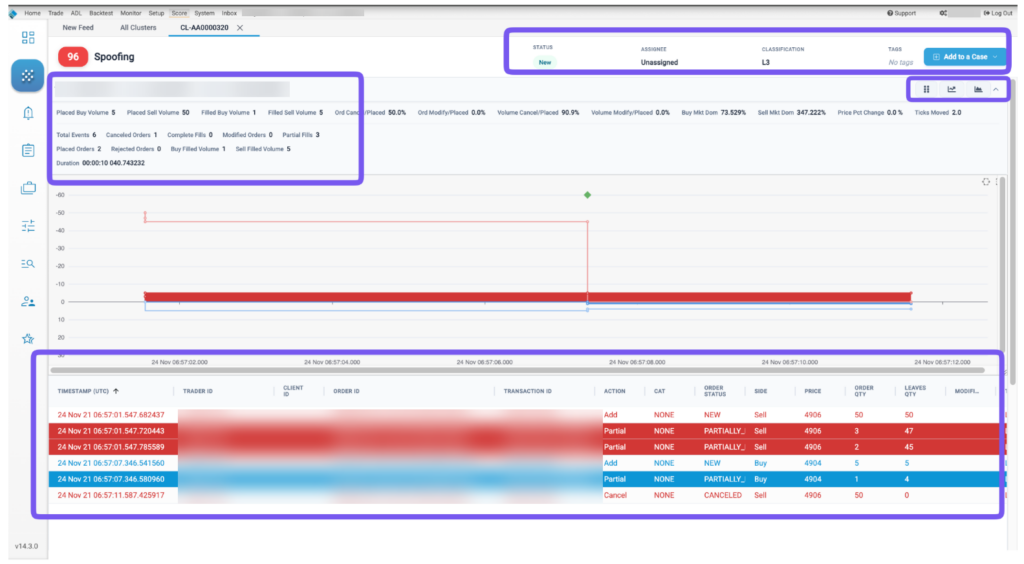
The Cluster Scorecard is organized into the following sections:
- Cluster Statistics and Scorecard Metrics: Displays statistics and metrics for the trading activity analyzed within the cluster.
- Cluster Attributes: Allows users to view and amend cluster attributes such as Status, Assignee, Classification, Tags
- Filled Positions and Working Orders: For the Spoofing model, displays the trading activity and volume of contracts traded within the cluster over a period of time. The trading details at each time interval are displayed when hovering over the chart. This section is dependent on the model as every model has their own chart type to display.
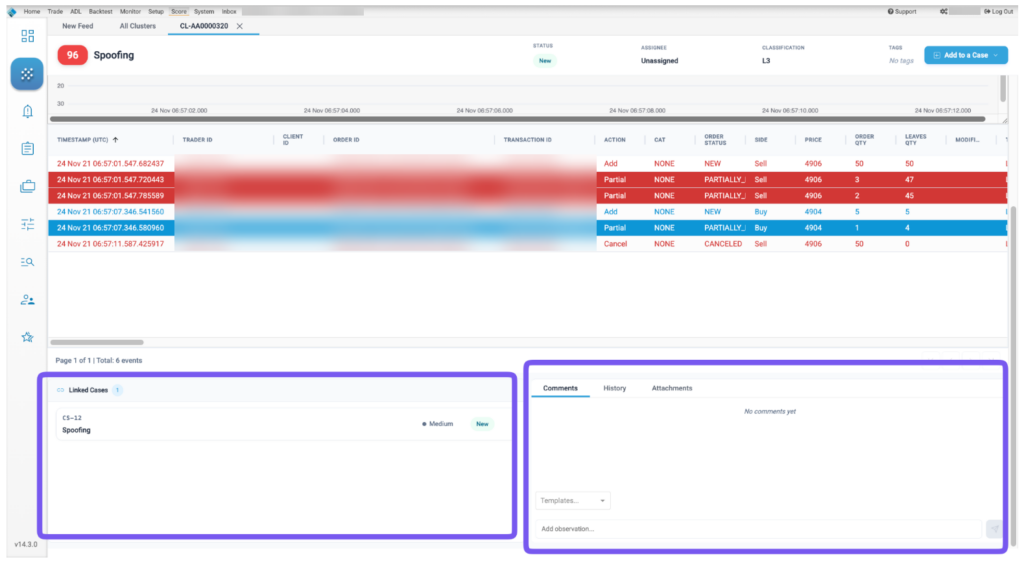
- Audit Trail Messages: Shows the actual order actions and fills from the audit trail. Rows are color coded by action and side. Click each row to display the order history or fill details.
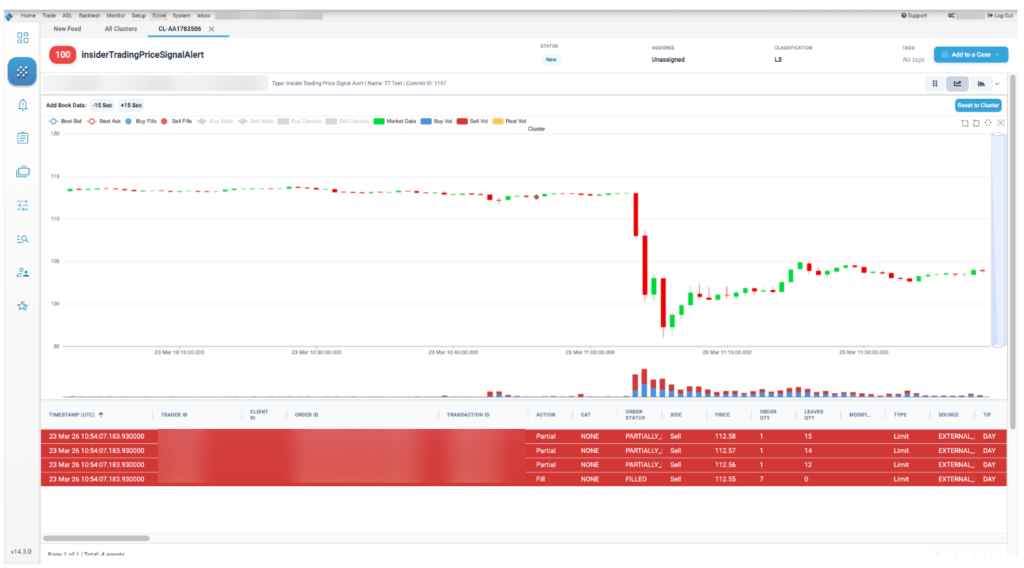
- Market Overlay: Provides different time-based views of the trading activity overlaid with market data in a ladder view or a macro view.
- Add to a Case: Allows users to add the cluster to an existing or a new case
Cluster statistics and scorecard metrics
The Cluster Statistics and Scorecard Metrics sections provide general information about the cluster as well as model-specific details.
The lower part of the Cluster Statistics section includes summary details about the cluster. Click the down arrow to the right of the score to expand the statistics.
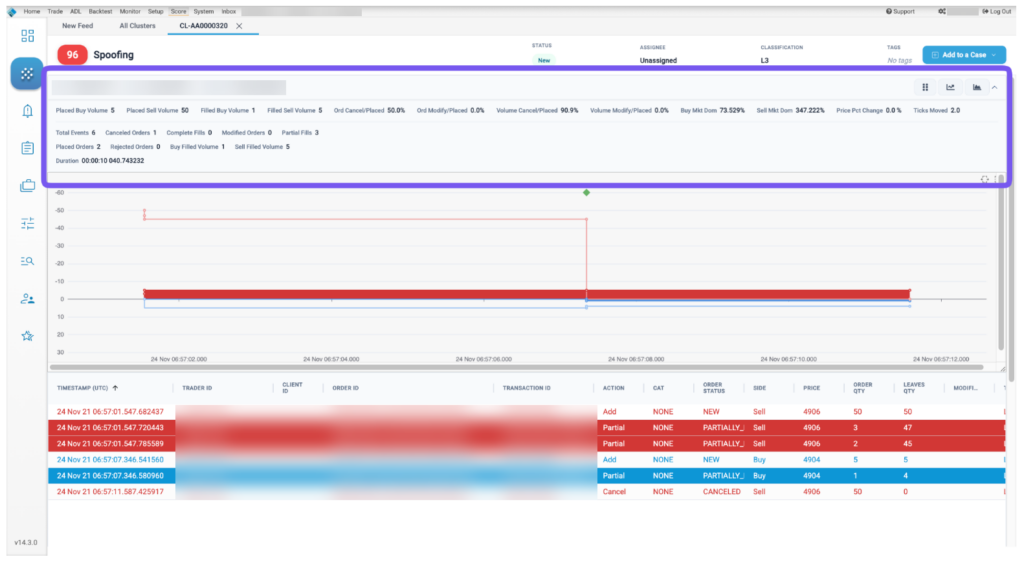
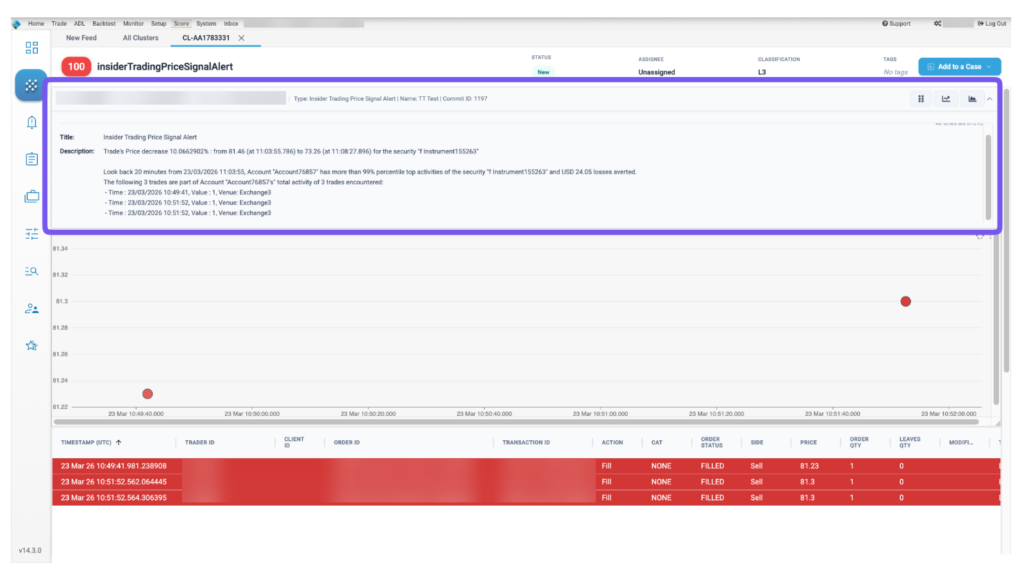
For configurable models, this also contains the human readable description of why the cluster was triggered:
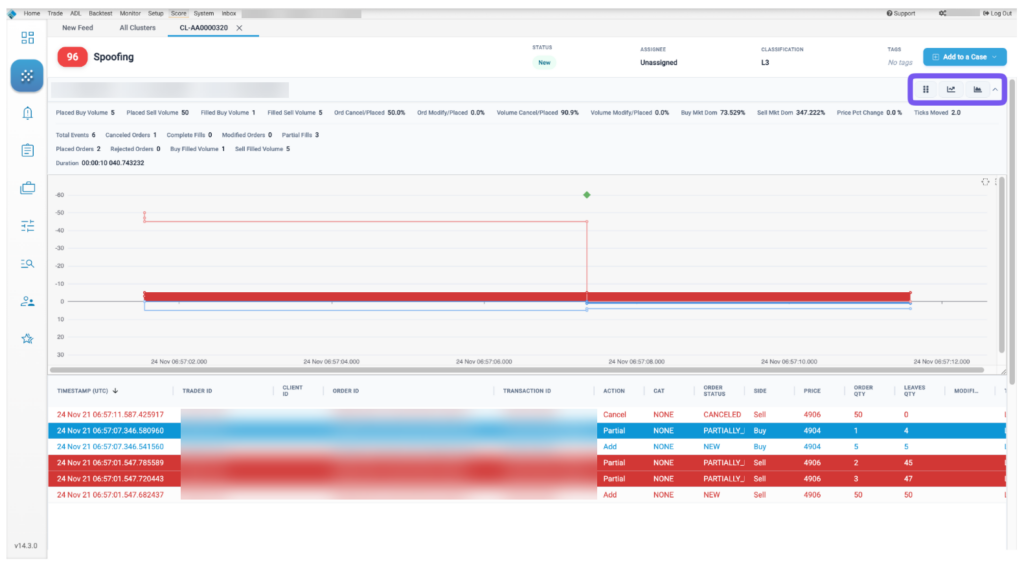
Audit trail
This section shows the actual order actions from the audit trail with some minor normalization of things like Order Type, Side and Order Action. Rows are color coded by action and side. Click the column selector ( ) above the audit trail to show additional columns.

Audit fields are described in the following table.
| Field | Description |
|---|---|
| Timestamp | Date and time the order was submitted. |
| Order ID | Unique TT order ID for internal tracking. |
| Transaction ID | The transaction identifier generated by and received from the Exchange. |
| Action | Type of order or fill action on the execution report. |
| Side | The side of trade (Buy or Sell). |
| Price | Order price |
| Order Qty | Order quantity |
| Leaves Qty | Remaining order quantity |
| Position | The user’s position. Positive numbers indicate a long position. Negative numbers indicate a short position. |
| Type | The order type. Supported order types vary by exchange. |
| TIF | The order Time-In-Force restriction. Supported TIFs vary by exchange. |
| Account | Account ID associated with the order. |
| Exchanges Time | For messages going to the exchange, this represents when the message is sent to the exchange from the order server. For messages received from the exchange, this represents when the message is sent from the order server to the rest of the TT platform. |
| Exch ID | Exchange defined execution identifier. |
| Order ID | Unique TT order ID for internal tracking. |
| User ID | The TT platform user identifier. |
| CAT | Crossing Action Type |
| Modifier | The modifier applied to the order. Example: Stop, If Touched, Trailing Stop, Trailing IT, Trailing Limit, Machine Gun |
| Order Status | State of the order on the execution report. |
| Working Quantity | The total order quantity working in the market. |
| Modifier | The modifier applied to the order. Example: Stop, If Touched, Trailing Stop, Trailing IT, Trailing Limit, Machine Gun |
| Agressorindicator | Indicates an aggressive order: true or false. |
| Parent ID | Parent order identifier. |
| CustOrderCapacity/td> | The FIX Tag 1031 value on the order message. |
| ManualOrderIndicator/td> | Indication of manual or automated order entry. Sent to the exchange in FIX Tag 1028. |
| AvgPx | Average price of the filled order. |
| BrokerId | Identifier of the broker submitting the order. |
| RefreshQty | The amount to refresh the displayed quantity at the exchange, typically set on Iceberg orders. |
| Source | Shows where the order originated from. |
| TrdMatchId | The user’s trade match prevention identifier. |
| Exec Type | Type of order or fill action on the execution report. |
| DisplayQty | The amount of the order to be publicly displayed at the exchange, typically set on iceberg orders. |
| LastQty | The amount filled on the order. |
| CumQty | The total quantity filled. |
| MinQty | The minimum quantity to be executed. |
| TradeType | The type of trade submitted. |
| AlgoId | For TT synthetic and algorithm orders, the identifier of the algorithm controlling the order. |
| CrossId | Self match prevention identifier provided by the exchange. |
| CurrUserId | identifier of the user who last touched an orders. |
| ExecInst | Execution instruction. |
| StopPx | Price at which price-triggered orders were executed. |
| SenderSubId | Identifier of the user submitting the trade. Value of FIX Tag 50. |
| AccountOverride | Account sent to the exchange as the clearing account. |
| EchoDc1 | Customer-defined text field that can be populated by FIX client applications. The value is not sent to the exchange, but remains visible in TT. |
| EchoDc10 | Customer-defined text field that can be populated by FIX client applications. The value is not sent to the exchange, but remains visible in TT. |
| EchoDc2 | Customer-defined text field that can be populated by FIX client applications. The value is not sent to the exchange, but remains visible in TT. |
| EchoDc3 | Customer-defined text field that can be populated by FIX client applications. The value is not sent to the exchange, but remains visible in TT. |
| EchoDc4 | Customer-defined text field that can be populated by FIX client applications. The value is not sent to the exchange, but remains visible in TT. |
| EchoDc5 | Customer-defined text field that can be populated by FIX client applications. The value is not sent to the exchange, but remains visible in TT. |
| EchoDc6 | Customer-defined text field that can be populated by FIX client applications. The value is not sent to the exchange, but remains visible in TT. |
| EchoDc7 | Customer-defined text field that can be populated by FIX client applications. The value is not sent to the exchange, but remains visible in TT. |
| EchoDc8 | Customer-defined text field that can be populated by FIX client applications. The value is not sent to the exchange, but remains visible in TT. |
| EchoDc9 | Customer-defined text field that can be populated by FIX client applications. The value is not sent to the exchange, but remains visible in TT. |
| Giveup | The giveup party account. |
| LastPx | Price of this fill. |
| LegCumQty | The total quantity filled for the leg. |
| OmaParentOrderId | Unique TT Order ID for an OMA parent order. |
| OrdRejReason | Reason the order was rejected at the exchange. |
| OrderOrigination | Identifies the origin of the order. |
| OrderSequence | Order message sequence number. |
| SecondaryExecId | Unique TT execution ID for the execution type. |
| SecondaryOrderId | Identifier for the party accepting the order. |
| SyntheticType | Type of synthetic parent order. |
| TextA | Optional, user-defined text value. Remains on the order in the TT system. |
| TextB | Optional, user-defined text value. Remains on the order in the TT system. |
| TextC | Read-only, customer-defined text value set by FIX client applications. The value is not sent to the exchange. |
| Text | Optional, user-defined text value. Remains on submitted orders for tracking purposes in the TT system, but is not routed to the exchange. |
Market Replay
The Market Replay section of the Cluster Scorecard lets users view the cluster data overlaid on the market data as it occurred over time.
Users can display the replay data with the following views:
Ladder view: Replays the market activity in a ladder-like interface as it occurred during the time period covered by the cluster.
Dual Ladder view: Allows viewing market activity in a second instrument to access potential trading impact.
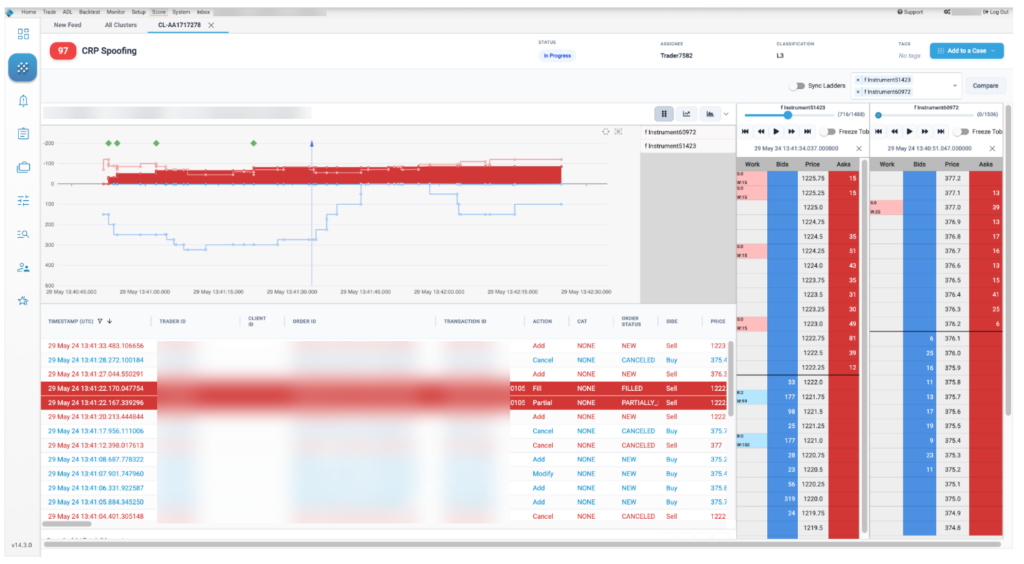
Market Depth Chart: Allows users to view the market movements overlaid on their trading data to show price volatility and volume concentrations in and around the cluster