


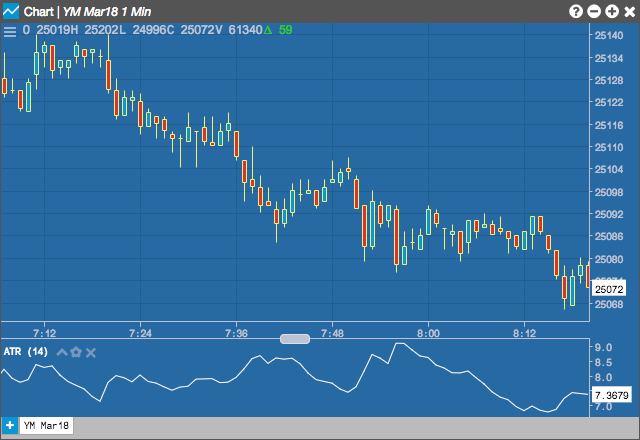
The Average True Range (ATR) study measures the size of the period’s range, and takes into account any gap from the close of the previous period.
Configuration Options
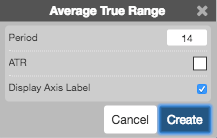
- Period: Number of bars to use in the calculations.
- Color Selectors: Colors to use for graph elements.
- Display Axis Label: Whether to display the most recent value on the Y axis.
Formula
\[Average\;True\;Range = average(TR, n)\]
where:
\(TR = max(High_{t} – Close_{t-1}\;,\;Close_{t-1} – Low_{t}\;,\;High_{t} – Low_{t})\) \(n = period\)