


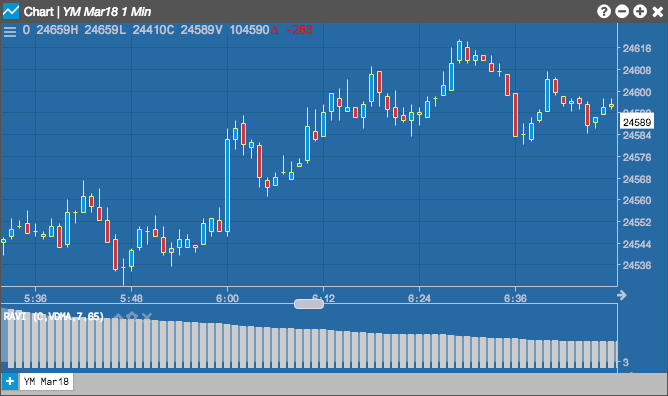
The RAVI indicator shows the percentage difference between current prices and past prices to identify market trends. It is calculated based on moving averages of different lengths.
Configuration Options
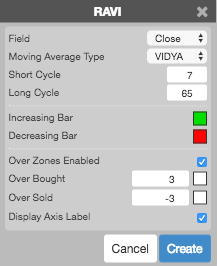
Field: Price or combination of prices to use as the base for average calculations. Possible values include:
-
Open
-
High
-
Low
-
Close
-
Adjusted Close
- HL/2 \( \left ( \frac{High + Low}{2} \right ) \)
- HLC/3 \( \left ( \frac{High + Low + Close}{3} \right ) \)
- HLCC/4 \( \left ( \frac{High + Low + Close + Close}{4} \right ) \)
- OHLC/4 \( \left ( \frac{Open + High + Low + Close}{4} \right ) \)
- Moving Average Type: Type of moving average to use in the calculations:
- Simple
- Exponential
- Time Series
- Triangular
- Variable
- VIDYA
- Weighted
- Welles Winder
- Hull
- Double Exponential
- Triple Exponential
- Short Cycle: Length of the long-moving average period.
- Long Cycle: Length for the short-moving average period.
- Color Selectors: Colors to use for graph elements.
- Over Zones Enabled: Whether to shade the area between the plot and the horizontal overbought and oversold levels.
- Over Bought: Overbought quantity
- Over Sold: Oversold quantity
- Display Axis Label: Whether to display the most recent value on the Y axis.
Formula
\[ RAVI = \frac{100 * (n{\text -}period\;short\;moving\;average – n{\text -}period\;long\;moving\;average)}{n{\text -}period\;long\;moving\;average} \]