


On the New Feed tab, the Heatmap shows you which traders, accounts, or instruments are generating activity that has a high degree of similarity to regulatory cases. Each rectangle represents a group of clusters using color to indicate the level of risk, and size to indicate the number of clusters. These visual cues help you prioritize your cluster group review based on activity that generates the most risk.
Manage the content displayed in your New Feed tab through the preferences. Here, you can customize your view by setting criteria such as the minimum cluster score, desired cluster status, specific models, and the relevant date range for the clusters you want to see. All these settings can be adjusted in the Preferences tab to meet your specific needs.
Heatmap Display
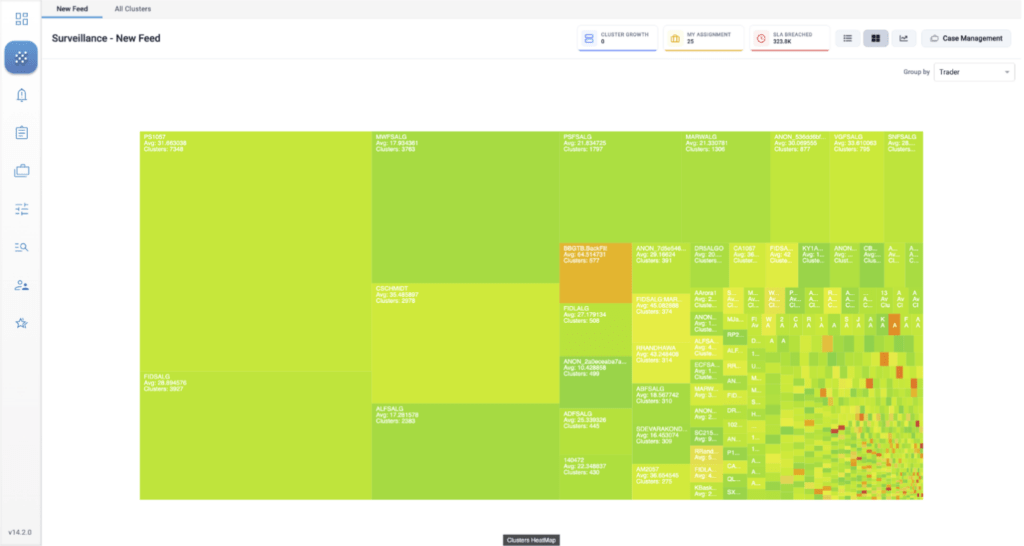
Interpreting the Heatmap
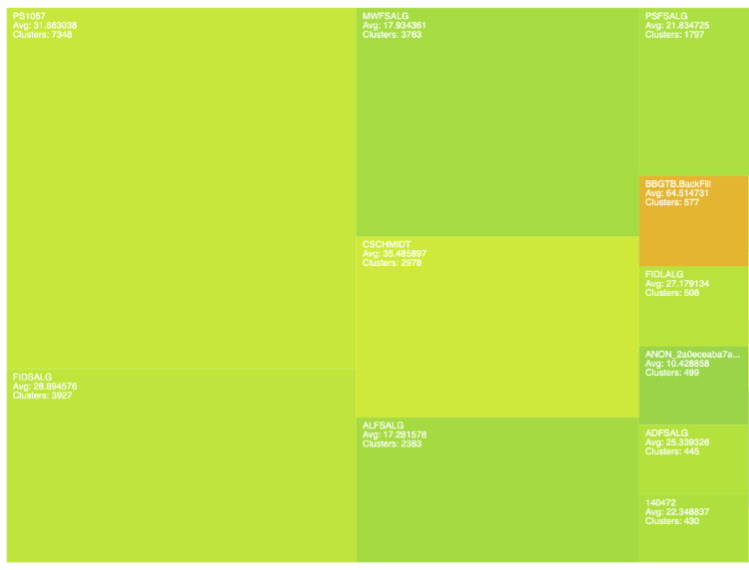
The Heatmap groups clusters by trader, instrument, or account, and displays these groups as a collection of blocks. TT Score calculates an average risk score for each block based on the clusters in the group represented by that block.
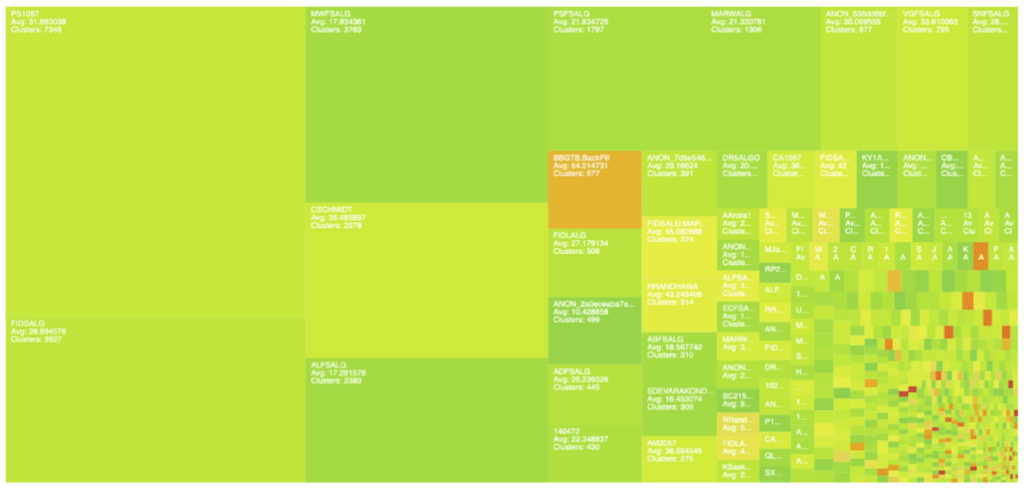
- The color of a block indicates the severity of the score. Low scores are represented as light green and high scores are represented as red.
- The size of a block indicates the number of clusters.
- Trader, Account, or Instrument ID: Shows the ID based on the “Group By” setting
- Max: Highest cluster score
- Avg: Average score of clusters within the group
- Clusters: Total number of clusters within the group
Heatmap Navigation
Navigation tools are located above the Heatmap.

- Select View: Switch between Individual Clusters, Heatmap, and Outlier Chart views.
- Group By: Sort the view by trader, account, and instrument.