


When you log in to TT Trade Surveillance, you’ll land on the TT Trade Surveillance dashboard page. The dashboard provides an interface for using TT Trade Surveillance functionality as shown.
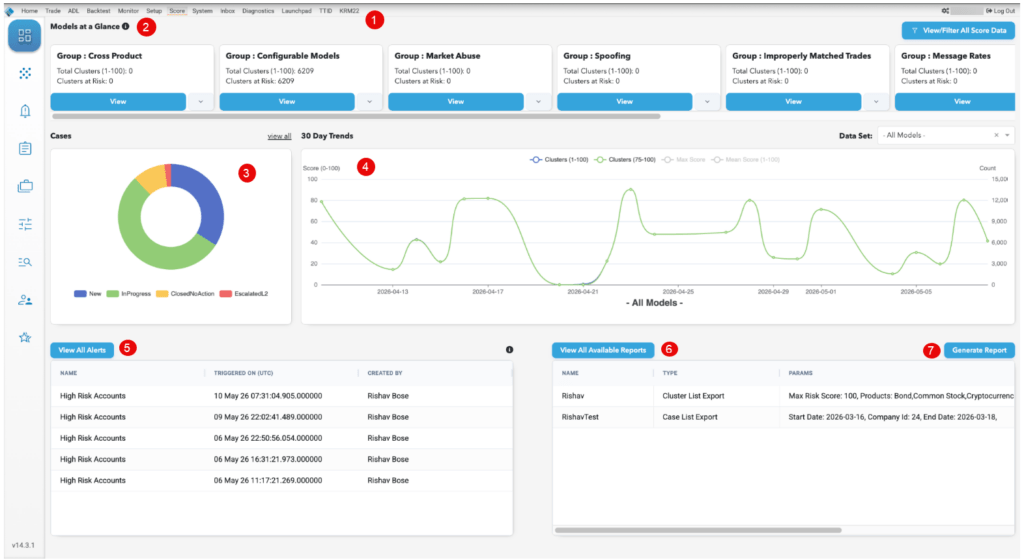
The dashboard includes:
- Tabs — The tabs provide access to the following TT Trade Surveillance functionality:
- Dashboard: Displays the TT Trade Surveillance dashboard.
- Surveillance: Is the starting point for your surveillance activities that serves as your prioritized to-do list.
- Alerts: Provides access to creating and viewing custom TT Trade Surveillance alerts.
- Reports: Allows you to generate and view compliance reports that quantify cluster statistics for your entire company and for individual traders.
- Cases: Allows you to view and manage open cases of suspect trading activity in your firm.
- Configurable Models: Allows you to create models to generate alerts when activity matches the specified parameters.
- DataLens: Allows you to interact with your data directly using filter, search, and query functions.
- Preferences: Sets display preferences for using surveillance models.
- Models at a Glance — Provides access to each surveillance model in TT Trade Surveillance.
- Cases — Shows the status of all investigations open in your firm.
- 30 Day Trends — Shows trends in suspect trading activity in your company for the last 30 days.
- View All Alerts — Shows alerts triggered in the last 7 days or 30 days.
- View All Available Reports — Displays all reports generated by your company.
- Generate Report – Allows you to generate compliance reports that quantify cluster statistics for your entire company and for individual traders.
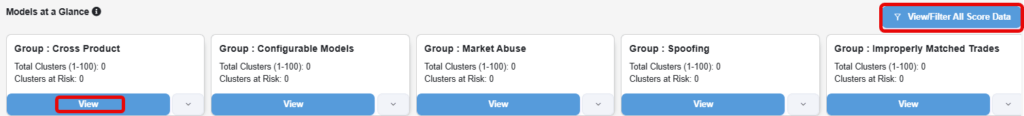
TT Trade Surveillance Dashboard: Models at a Glance
Clusters are displayed with only the previous day’s trading activity by default. Click View to open the Surveillance page and view the Cluster List for the selected model or click View/Filter All Score Data to open the Surveillance page and view data for all models, products, and filters.
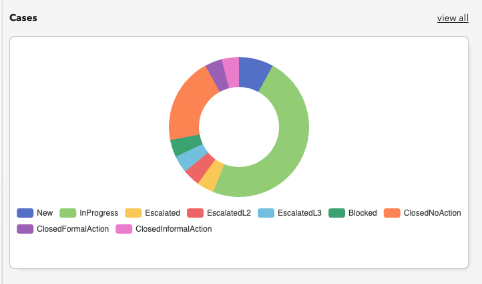
TT Trade Surveillance Dashboard: Cases
Hover on a status in the chart to display the percentage of investigations with that status. Click view all to go to the Cases page.
TT Trade Surveillance Dashboard: 30 Day Trends
Click Data Set to show risk trends for one or more models or all models combined. You can also hover on a data point to display the cluster scores on that particular date.

TT Trade Surveillance Dashboard: Alerts
This section displays triggered alerts based on the Date Range you select. Click View Clusters to go the Alerts page and display the clusters that triggered the alert, or click view all to go to the Alerts page and show all alerts created by your company.

TT Trade Surveillance Dashboard: Reports
This section allows you to select and generate new reports from the dashboard. You can hover on the displayed report parameters to show the details. Click view all to go to the Reports page and show all reports generated by your company.
