


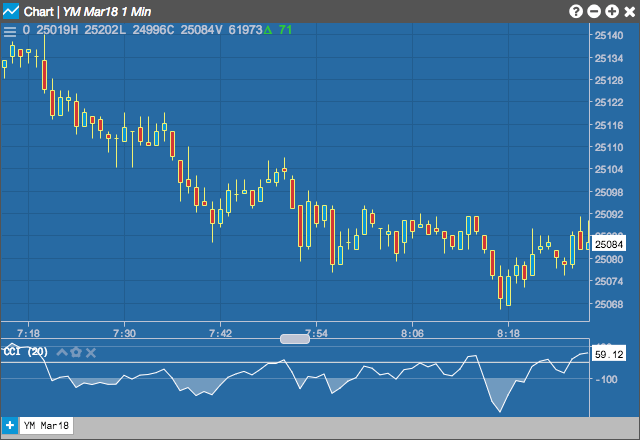
The Commodity Channel Index (CCI) compares the current mean price with the average mean price over a typical window of 20 periods.
Configuration Options
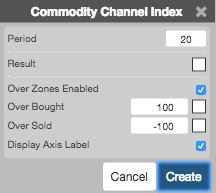
- Period: Number of bars to use in the calculations.
- Color Selectors: Colors to use for graph elements.
- Over Zones Enabled: Whether to shade the area between the plot and the horizontal overbought and oversold levels.
- Over Bought: Overbought quantity
- Over Sold: Oversold quantity
- Display Axis Label: Whether to display the most recent value on the Y axis.
Formula
\[CCI = \frac{( P – A )}{( 0.015 * D )}\]
where
\[\bullet\; P = Pivot = \frac{(High_{n-period} + Low_{n-period} + Close_{current\;close})}{3}\]
\[\bullet\; High_{n-period} = Highest\;price\;over\;n-periods\]
\[\bullet\; Low_{n-period} = Lowest\;price\;over\;n-periods\]
\[\bullet\; Close_{current\;close} = Current\;close\;price\]
\[\bullet\; A = n\text{-}period\;moving\;average\;of\;the\;pivot\;value\;P \]
\[\bullet\; D = mean\;deviation\;of\;the\;absolute\;value\;of\;the\;difference\;between\;the\;mean\;price\;and\;the\;moving\;average\;of\;the\;mean\;price, P-A \]