


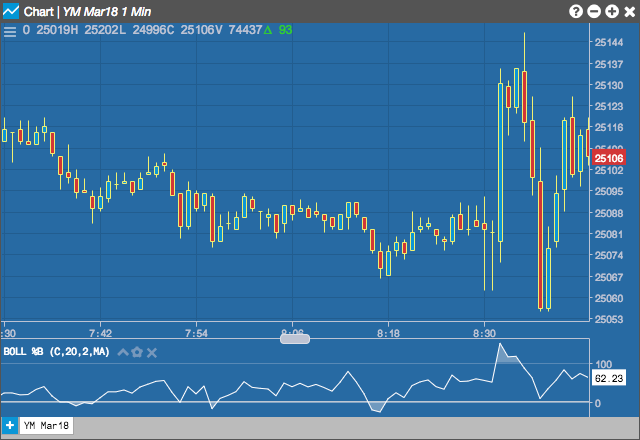
The Boll %B indicator finds the position of a security within Bollinger Bands. BBoll %B is simply a percentage measure of a security’s location between the bands. Boll %B can be lower than 0 or higher than 100 if price moves outside the bands
Generally speaking, a Boll %B near or above 100 can suggest an overbought market, while a value near or below 0 can indicate an oversold market.
Configuration Options
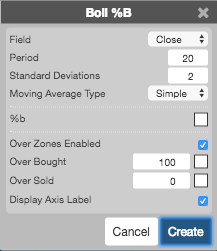
- Field: Price or combination of prices to use as the base for average calculations. Possible values include:
-
Open
-
High
-
Low
-
Close
-
Adjusted Close
- HL/2 \( \left ( \frac{High + Low}{2} \right ) \)
- HLC/3 \( \left ( \frac{High + Low + Close}{3} \right ) \)
- HLCC/4 \( \left ( \frac{High + Low + Close + Close}{4} \right ) \)
- OHLC/4 \( \left ( \frac{Open + High + Low + Close}{4} \right ) \)
- Period: Number of bars to use in the calculations.
- Standard Deviations: Number of standard deviations above and below the average to draw the bands.
- Moving Average Type: Type of moving average to use in the calculations:
- Simple
- Exponential
- Time Series
- Triangular
- Variable
- VIDYA
- Weighted
- Welles Winder
- Hull
- Double Exponential
- Triple Exponential
- Color Selectors: Colors to use for graph elements.
- Display Axis Label: Whether to display the most recent value on the Y axis.
Typically, bandwidth parameters will match the user’s preferred Bollinger Band parameters.
Formula
\[Boll\;\%B = \frac{(Price – Lower\;Band)}{(Upper\;Band – Lower\;Band)} \]