





Trade
Overview
TT Platform
Description
Task
Browser Access
Description
Task
Videos
TT Desktop
Description
Task
Videos
Reference
Workspace Windows
Description
Task
Videos
Widgets
Description
Task
Preferences
Description
Viewing Market Data
Time and Sales
Task
Reference
Description
Depth
Description
Task
Reference
Market Grid
Description
Task
Videos
Reference
Product Grid
Description
Task
Reference
Spread Matrix
Description
Task
Videos
Reference
Position in Queue (PIQ)
Basic Order Entry
TT Order Types
Description
Task
Videos
Reference
Case Studies
TT Premium Order Types
Description
Task
Reference
Order Ticket
Description
Task
Use Cases
Reference
MD Trader®
Description
Task
Videos
Reference
Order Profiles
Description
Task
Reference
Routing Rules
Description
Task
Blocktrader
Description
Task
Videos
Reference
Trading Crypto on TT
Description
Task
Videos
Reference
Trading on B3
Order Management
Order Book
Description
Task
Reference
Floating Order Book
Description
Task
Reference
Fills
Description
Task
Reference
Positions
Description
Task
Reference
Orders and Fills
Description
Task
Reference
Audit Trail
Description
Task
Reference
Audit Query
Description
Task
Reference
Account List
Description
Task
Videos
Reference
Position Manager
Description
Task
Reference
Alert Manager and Alert Viewer
Description
Task
Videos
Reference
Account & User Restrictions
Description
Task
Reference
Balances
Description
Task
Reference
TT® OMS
Care Orders
Description
Task
Videos
Reference
Lock and Release
Description
Task
Bulking
Description
Task
Videos
Stitching and Splitting
Description
Task
Combining
Description
Task
Order Passing
Description
Task
Use Cases
Order Exceptions
Description
Task
Options
Options Risk
Description
Task
Videos
Reference
QuikStrike
Description
Task
TT Uncovered 3.0
Description
Task
TT Uncovered 2.0
Description
Task
Volatility Calculator
Description
Task
Expiration Manager
Description
Task
Watchlist
Description
Task
Videos
Reference
Options Risk Matrix
Description
Task
Videos
Reference
Options on TT
Description
Videos
Strategy Creation
Description
Task
Use Cases
Reference
Counterparty Manager
Description
Task
RFQ with Counterparties
Description
Task
RFQ Viewer
Description
Task
Videos
Reference
Electronic Eye
Description
Task
Videos
Reference
Vol Curve Manager
Description
Task
Use Cases
Videos
Reference
Options Trade Monitor
Description
Task
Videos
Reference
Options Chain
Description
Task
Use Cases
Videos
Reference
Spread Trading
Autospreader
Description
Task
Use Cases
Videos
Reference
Autospreader Rules
Description
Task
Videos
Reference
Hedge Manager
Description
Task
Videos
Reference
Trading in Yield
Description
Task
Use Cases
Reference
Aggregator
Description
Task
Videos
Reference
Algo Trading
Algo Dashboard
Description
Task
Videos
Reference
Template Manager
Description
Task
Order Management Algos (OMAs)
Autotrader
Description
Task
Reference
Videos
Excel integration with TT
Description
Task
Videos
Reference
Market-Making Algos
Analytics
Charts
Description
Technical Indicators
Task
Videos
Reference
Trader Analytics
Description
Task
Reference
ADL
ADL Overview
Introduction to ADL
Description
Task
Videos
Reference
ADL Basic Concepts
Description
Task
Reference
Building your first algo
Lessons
Advanced concepts
Description
Task
Case Studies
Jump blocks
Group blocks
Virtualized blocks
Library blocks
Trading Blocks
Discrete blocks
Arithmetic blocks
Basic blocks
Logic blocks
Miscellaneous blocks
Setup
Setup Overview
Getting Started
Description
Task
Videos
Reference
Supported Order Types and TIFs
Company Administration
Connections
Description
Task
Videos
Reference
Accounts
Description
Task
Videos
Use Cases
Reference
Users
Description
Task
Videos
Reference
Company
Description
Task
Reference
Order Tag Defaults
Description
Task
Account Administrators
Description
Task
TT Premium Services
Description
Task
TT Access
Description
Task
Advanced Features
Description
Risk Management
Risk Administration
Description
Task
Risk Limits
Description
Task
Videos
Reference
Pre-Trade Portfolio Risk
Description
Task
Reference
Order Cross Prevention
Description
Task
Videos
KRM Limits
Description
Task
TT® OMS
TT OMS Administration
Description
Task
Use Cases
Reference
Exchanges: Americas
FMX
Description
Task
NFI
Task
Nodal
Description
Task
MX
Description
Task
MIAX_FUT_NY
Description
Task
MIAX_FUT_CH
Description
Task
MexDer
Description
Task
ICE
Description
Task
Goldman Sachs Commodity Blocks (GSCB)
Description
Task
Referece
FMX_USTF
Description
Task
B3
Description
Task
Fenics
Description
Task
EBS Market
Description
Task
EBS Direct
Description
Task
Dealerweb
Description
Task
CME
Description
Task
CFE
Description
Task
Cboe FX
Description
Task
Reference
CBOE
Description
Task
Exchanges: EMEA
GFO-X
Description
Task
WSE
Description
Task
Nord Pool
Description
Task
Reference
NASDAQ_NED
Description
Task
MEFF
Description
Task
LSE
Description
Task
LME NTP
Description
Task
LME
Description
Task
JSE
Description
Task
ICE_L
Description
Task
ATHEX
Description
Task
Euronext
Description
Task
Eurex
Description
Task
Videos
Eris
Description
Task
EPEX SPOT
Description
Task
Reference
EEX
Description
Task
DGCX
Description
Task
BIST
Description
Task
Exchanges: Asia/Pacific
ABX
Description
Task
ASX
Description
Task
FEX
Description
Task
HKEx
Description
Task
JPX
Description
Task
NSE
Description
Task
NZX
Description
Task
SGX
Description
Task
SGX GIFT
Description
Task
TAIFEX
Description
Task
TFEX
Description
Task
TFX
Description
Task
CoinFLEX
Task
Coinbase
Description
Task
FIX Support
FIX Ruleset
Description
Task
FIX Sessions
Description
Task
Secondary Accounts
Description
Task
Monitor
TT Mobile
TT Backtesting
APIs
TT REST API 2.0
Getting Started
API Reference
TT REST API 2.0 (UAT)
Getting Started
API Reference
TT .NET SDK
Getting started with TT .NET SDK
Creating the application framework
Working with instruments
Subscribing for market data
More about prices
An in-depth look at the Price class
Working with orders and fills
Handling trade subscriptions
Working with trade subscriptions
Working with Algos
Algo Server
TT Order Types
TT Premium Order Types
Advanced Concepts and Options
Appendix
TT CORE SDK
Getting Started with TT Core SDK
Creating Application Framework
Working With Instruments
Subscribing for Market Data
Working with Orders and Fills
Creating a TT Application Server
Appendix
TT Trade Surveillance
Overview
Using TT Trade Surveillance
Cluster View
Core Models
Market Abuse Models
Cross Product Models
Spoofing Models
Improperly Matched Trade Models
Market Rate Models
Trading Behaviors Models
Miscellaneous Models
Configurable Models
Reports
Reference
TT FIX Services
TT FIX General
Getting Started
FIX Message Structure
Session messages
TT FIX Order Routing
Overview
TT FIX message conversations
Supported application messages
TT FIX Market Data
Overview
TT FIX message conversations
Supported application messages
TT FIX Drop Copy Out
Overview
TT FIX Message Conversations
Supported application messages
Compliance Feed messages
TT FIX Drop Copy In
Overview
Supported application messages
TT FIX Gateway
Getting Started
FIX Message Structure
Components
Session messages
Price Gateway Messages
Order Gateway Messages
TT FIX Recovery
Overview
FIX Recovery Methods
Supported application messages
Compliance Feed Messages
MiFID II Support

Disruptive Order

The Disruptive Order model detects aggressive orders that instantly fill through multiple price levels. Causing rapid
price moves by placing orders that are either too large or aggressively priced can be seen as disruptive trading
behavior and may garner regulatory scrutiny.

Disruptive Order scoring methodology

Scoring of this model is primarily based on the number of price levels traded through in an aggressive manner. There
are
smaller scaled reductions in Score for extremely small price moves in relation to the instrument price, and for low
percentages of aggressive fills.

Disruptive Order scorecard metrics

The Scorecard Metrics section measures the following statistics related to a
Disruptive Order:

  • Aggressor Fill Pct: The percentage of trader volume that filled aggressively.

    Note: Applies to exchanges
    that have an aggressor fill tag.

  • Aggressor Fill Qty: The quantity of aggressive order fills.

    Note:
    Applies to exchanges that have an
    aggressor fill tag.

  • Buy Fill Ratio: The ratio of Buy fills to total fills.
  • Disruption Fill Qty: The quantity of the disruptive order that was filled.
  • Pct Tot Ticks Moved: “Ticks Moved” divided by “Ticks Btwn HighLow”.
  • Price Levels: Number of price levels at which the aggressive order was filled. The sequence of price levels
    at which fills occur corresponds to the movement in the market price.
  • Price Pct Change: Percent of price change resulting from the disruptive order.
  • Prices: The list of fill prices in ascending or descending order.
  • Sell Fill Ratio: The ratio of Sell fills to total fills.
  • Session High: The highest price for the instrument during the session.
  • Session Low: The lowest price for the instrument during the session.
  • Side: Indicates which side of the trade the disruptive order is (Buy or Sell).
  • Ticks Btwn HighLow: Total amount of ticks between the high and low price of the session.
  • Ticks Moved: Amount of ticks the price moved through due to the traders activity.
  • Ticks Size: Pricing increment of the instrument.
  • VWAP Buy: The average traded price of an instrument based on Buy volume and price.
  • VWAP Sell: The average traded price of an instrument based on Sell volume and price.

Identifying a Disruptive Order

If the Disruptive Order model displays multiple price levels for a cluster, this may indicate that the trader is
attempting to ignite a price movement in a particular direction (Buy or Sell) to mislead other market participants or
create an artificial price.

When investigating Disruptive Order clusters with TT Trade Surveillance, consider the following:

  • The number of price levels at which the aggressive order was filled.
  • Any trader activity immediately before or after the disruptive order

Using the Cluster Scorecard, you can analyze the activity that
triggered the high cluster score. The pressure chart
on the scorecard provides visual clues about the potential suspect trading pattern. The audit trail data on the
scorecard can be used to verify order information and timing of the activity. The following example shows trading
activity identified as a potential Disruptive Order.
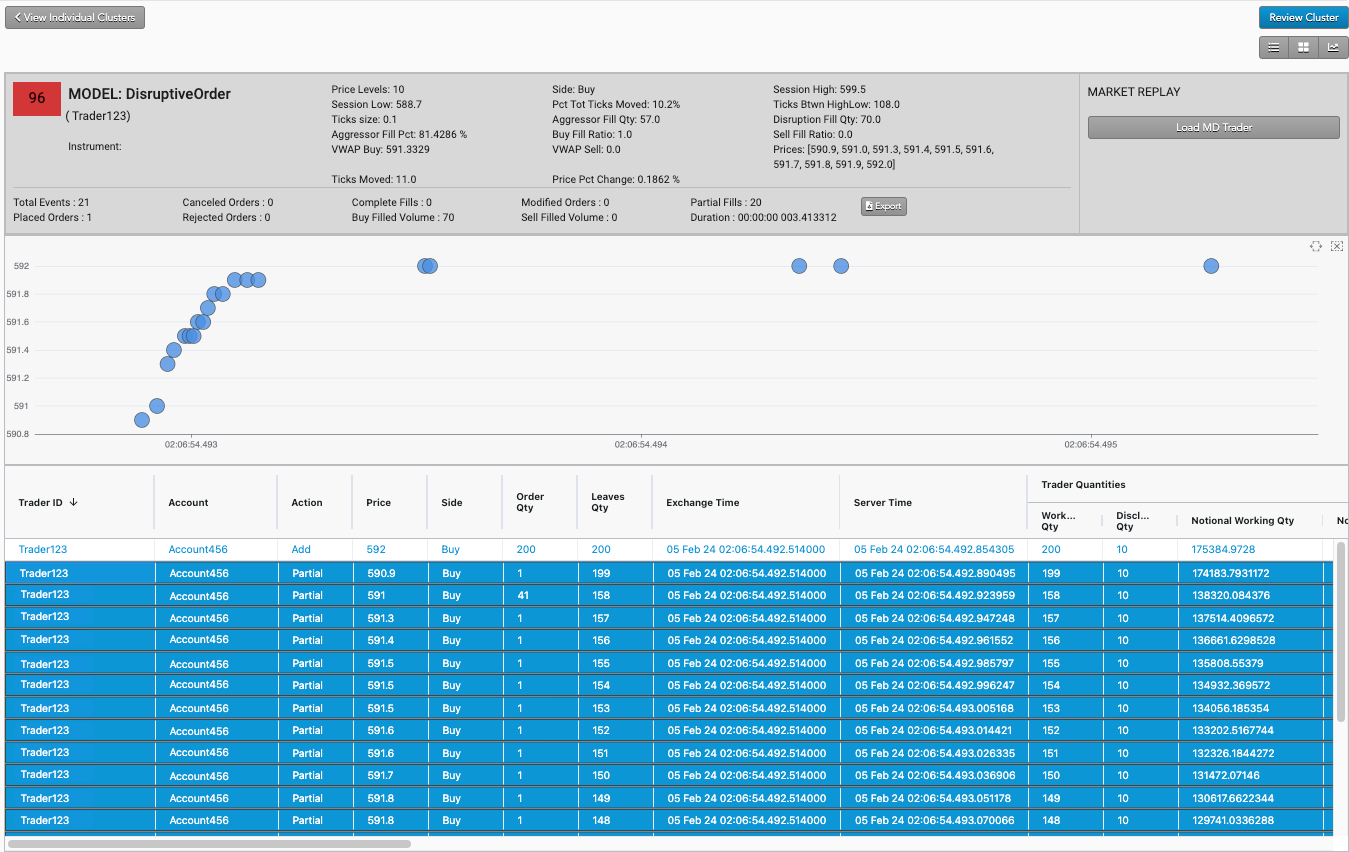
In this example:

  1. The chart shows a series of blue bubbles at sharply increasing prices over a short period of time.
  2. The “Action” column in the audit trail shows that a large order received many partial fills across many price
    levels in a short time span.
  3. The “Price” column shows the aggressive buy order was placed above the market.
Dominating the Close

Dominating the Close occurs when a single trader’s fills make up the majority of
the market volume of an instrument during the final two (2) minutes of the market
session. The Dominating the Close model in TT Trade Surveillance analyzes and scores clusters
that may indicate that a single trader is dominating the total traded volume
for an instrument during the market close.

When a single trader’s resting orders make up the majority of the fill volume
for an instrument, they have control over the pricing of that instrument. The
Dominating the Close model can alert your firm to this behavior, which may be an
indication of potential market manipulation.

Note: The Dominating the Close model only identifies potentially
suspicious trading behavior. This model does not necessarily reflect an actual
rule violation.

Scoring methodology

Scores are based on the percent of trader volume compared to the total market volume and a measure of how aggressive
that trading was.

Dominating the Close score interpretation

Each cluster is assigned a risk score on a sliding scale between 0-100. This
score represents the probability that Dominating the Close occurred during the
duration of the cluster’s trading activity.

Based on TT Trade Surveillance best practices, clusters that score over 75 are deemed to be “high risk” and should be the primary focus of users during their compliance reviews.

Dominating the Close scorecard metrics

The Scorecard Metrics section measures the following statistics related to
market close dominance:

  • Vol During Close (2 min) — Total traded volume in the final 2 minutes of the session.
  • Trader Buy Fill Vol — The trader’s total volume of buy side fills for the current trading session.
  • Trader Sell Fill Vol — The trader’s total volume of sell side fills for the current trading session.
  • Trader Fill Vol At Close — The trader’s total volume of both buy and sell side fills for the final 2
    minutes of the session.
  • Trader Vs Session At Close — The ratio of the trader’s fill quantity and the total fill quantity for an
    instrument in the final 2 minutes of the session.
  • Trader Buy Vs Total Fill Vol — The ratio of the trader’s total volume of buy side fills and the total
    fill volume for the trading session.
  • Trader Sell Vs Total Fill Vol — The ratio of the trader’s total volume of sell side fills and the total
    fill volume for the trading session.
  • LTP Session — The instrument’s last traded price for the current session.
  • OpenPrice Session — The instrument’s opening price at the start of the current session.
  • Closeprice Previous Session — The instrument’s closing price at the end of the previous session.
  • Aggressor Ratio — The ratio of aggressive to passive orders.
    This is a key metric in determining the overall cluster’s score.
  • Ticks Away LTP Vs Close — The number of ticks between the last traded price and the close price.
  • Ticks Away LTP Vs Open — The number of ticks between the last traded price and the open price.
  • VWAP Buy — The volume-weighted average price for buy orders for the session.
  • VWAP Sell — The volume-weighted average price for sell orders for the session.
  • Ticks Chg VWAP Vs Close — The difference, in ticks, between the volume-weighted average price and the
    close price for the session.

  • Ticks Chg VWAP Vs Close Side
    — The side of the market used to calculate the Ticks Chg VWAP Vs Close
    value.
  • Ticks Chg VWAP Vs Open — The difference, in ticks, between the volume-weighted average price and the
    open price for the session.

  • Ticks Chg VWAP Vs Open Side
    — The side of the market used to calculate the Ticks Chg VWAP Vs Open
    value.
  • Session StartTime — The start time for the trading session.
  • Session EndTime — The end time for the trading session.
  • Identifying Dominating the Close

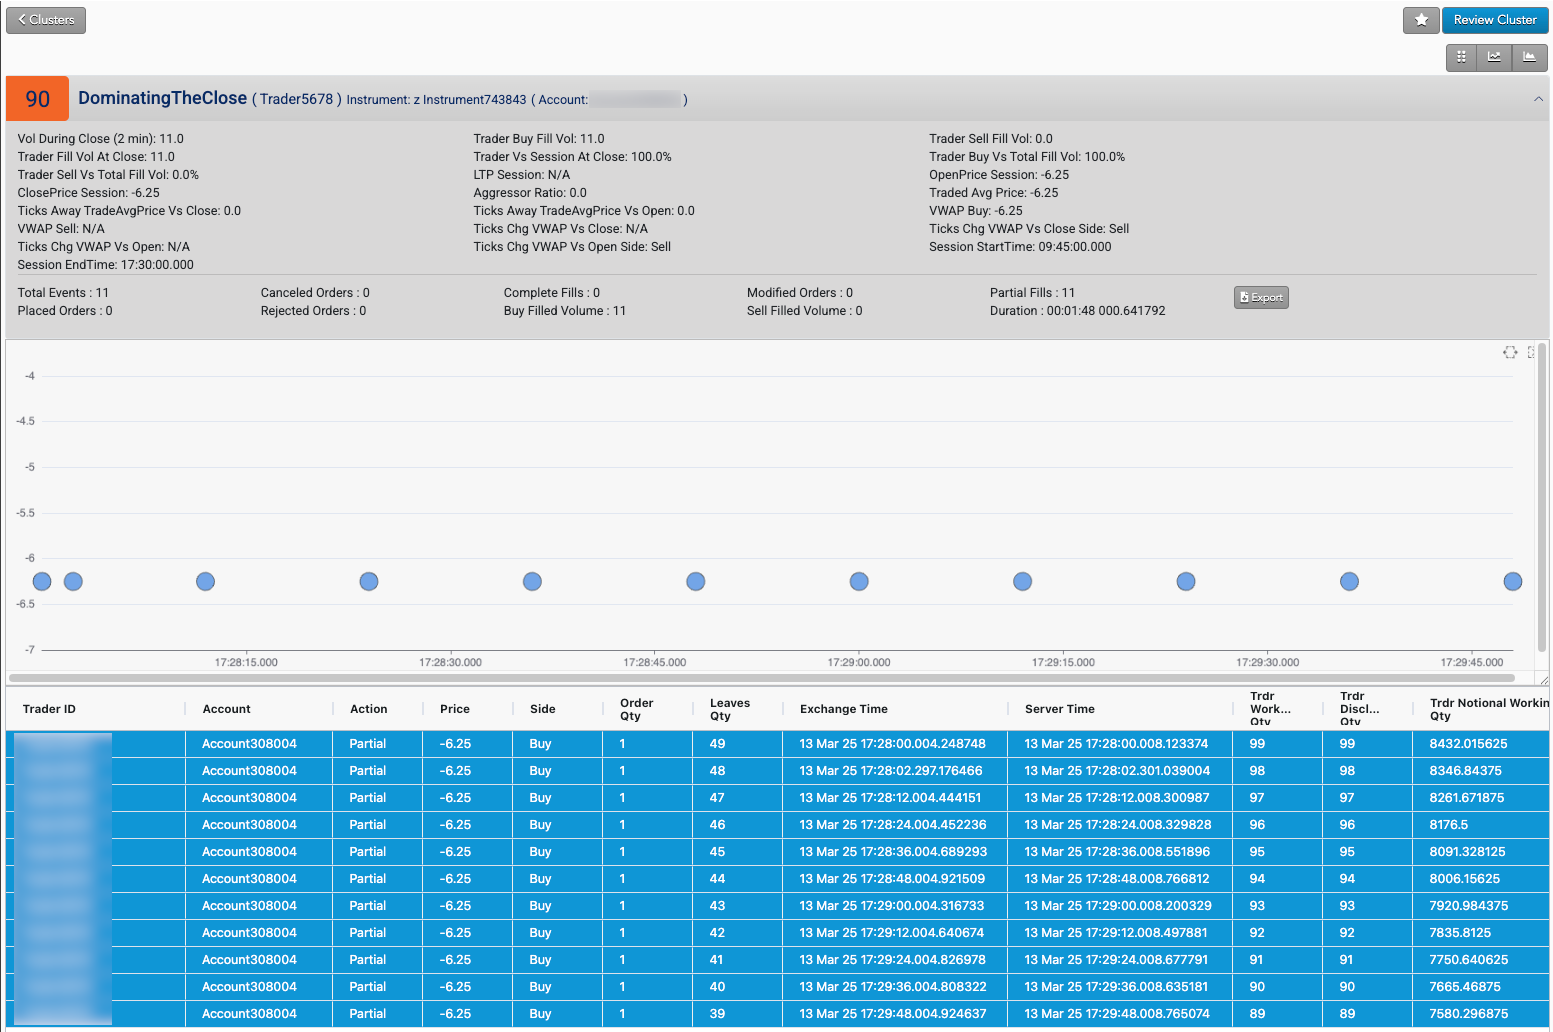
    Using the
    Cluster Scorecard, you
    can view the details of the activity that triggered the market open dominance
    score.

    For example:

    1. The Trader Vs Session at Close shows the trader submitted a high
      percentage of the session orders during the final 2 minutes of trading.
    2. The Aggressor Ratio reflects a high ratio (more that 50%) between
      aggressive and passive orders.

    The Trader Vs Session at Open shows the trader submitted a high
    percentage of the session orders during the final 2 minutes of trading.

    Floor/Ceiling

    Floor/Ceiling model detects a pattern of trading activity intended to maintain the price of an instrument during the trading
    session. The pattern reflects an attempt to prevent the instrument price from trading lower (creating a price
    ‘floor’)
    or higher (creating a price ‘ceiling’).

    To keep a price from moving through a particular price level, a trader can place one order or multiple orders on one
    side (buy/sell) of the market at a specific price level. These orders include a significant amount of the trading
    volume relative to the normal amount for the
    instrument. This reduces the likelihood that the market will move though that price.

    This approach may not result in profit within the particular instrument, however, it may be related to another
    position that is tied to the price of this instrument.

    Scoring methodology

    To detect a trader’s potential for creating a price floor or a price ceiling, TT Trade Surveillance analyzes the following data
    during the trading period:

    • The low and high prices for the instrument during the trading session
    • Total market volume and percent of session volume traded at the high or low price
    • Trader’s volume at the high or low price level
    • Traders percentage of volume at the high or low price level
    • Trader’s percentage of market volume at the high or low price level
    • Trader’s percentage of passive trading at the high or low level

    Score interpretation

    The score assigned to a cluster is based on a sliding scale between 0-100 using a weighted calculation. A score of 75
    and above is a good indication that the suspect trading activity occurred.

    Based on TT Trade Surveillance best practices, clusters that score over 75 are deemed to be “high risk” and should be the primary focus of users during their compliance reviews.

    Scorecard metrics

    The Floor/Ceiling cluster scorecard includes metrics that help you determine if price manipulation may have
    occurred during the trading session.

    The following metrics are provided:

    • Session High — The high price for the instrument during the trading session.
    • Session Low — The low price for the instrument during the trading session.
    • Trdr Ssn Vol — The volume of trader’s activity for the session.
    • Trdr Ssn High Vol — The volume of trader’s activity that matches the instrument’s high price for
      the session.
    • Trdr Ssn Low Vol — The volume of trader’s activity that matches the instrument’s low price for the
      session.
    • Mkt Session Vol — The total trading volume for the session.
    • Trdr Ask Vol Pct Vs Trdr Ssn Vol: — The percentage of ask volume compared to the trader’s total
      volume for the session.
    • Trdr Vol Vs Mkt Vol — The trader’s percentage of volume for the total market volume.
    • Trdr Pct High Vol Vs Mkt Vol — The percentage of volume of trader’s activity that matches the
      instrument’s high price for the session versus the total market volume.
    • Trdr Pct High Vol Vs Trdr Ssn Vol: — The percentage of volume of trader’s activity that matches the
      instrument’s high price for the session versus the trader’s total volume for the session.
    • Trdr Pct Agg Vs Ssn Fill — Percent of trader’s aggressive trades versus the session fills.
    • Trdr High Fill Vs VAP High: — The volume of trader’s activity that matches the instrument’s high
      price for the session versus volume-at-price (VAP) at the same price level.
    • VAP High Prc — The percentage of volume that matches the instrument’s high price.

    • Trd Cnt High Prc
      — Count of fill or partial fill actions at the high/low by the trader.

    Identifying Floor/Ceiling

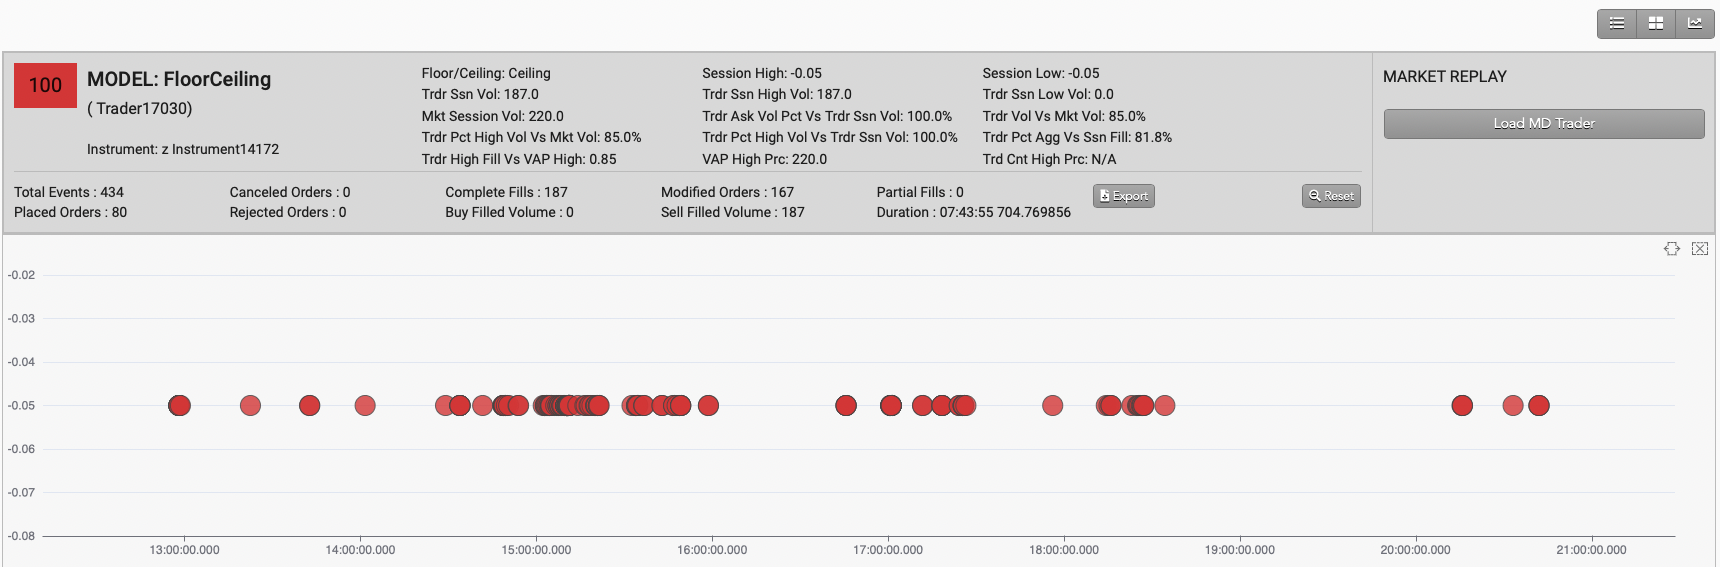
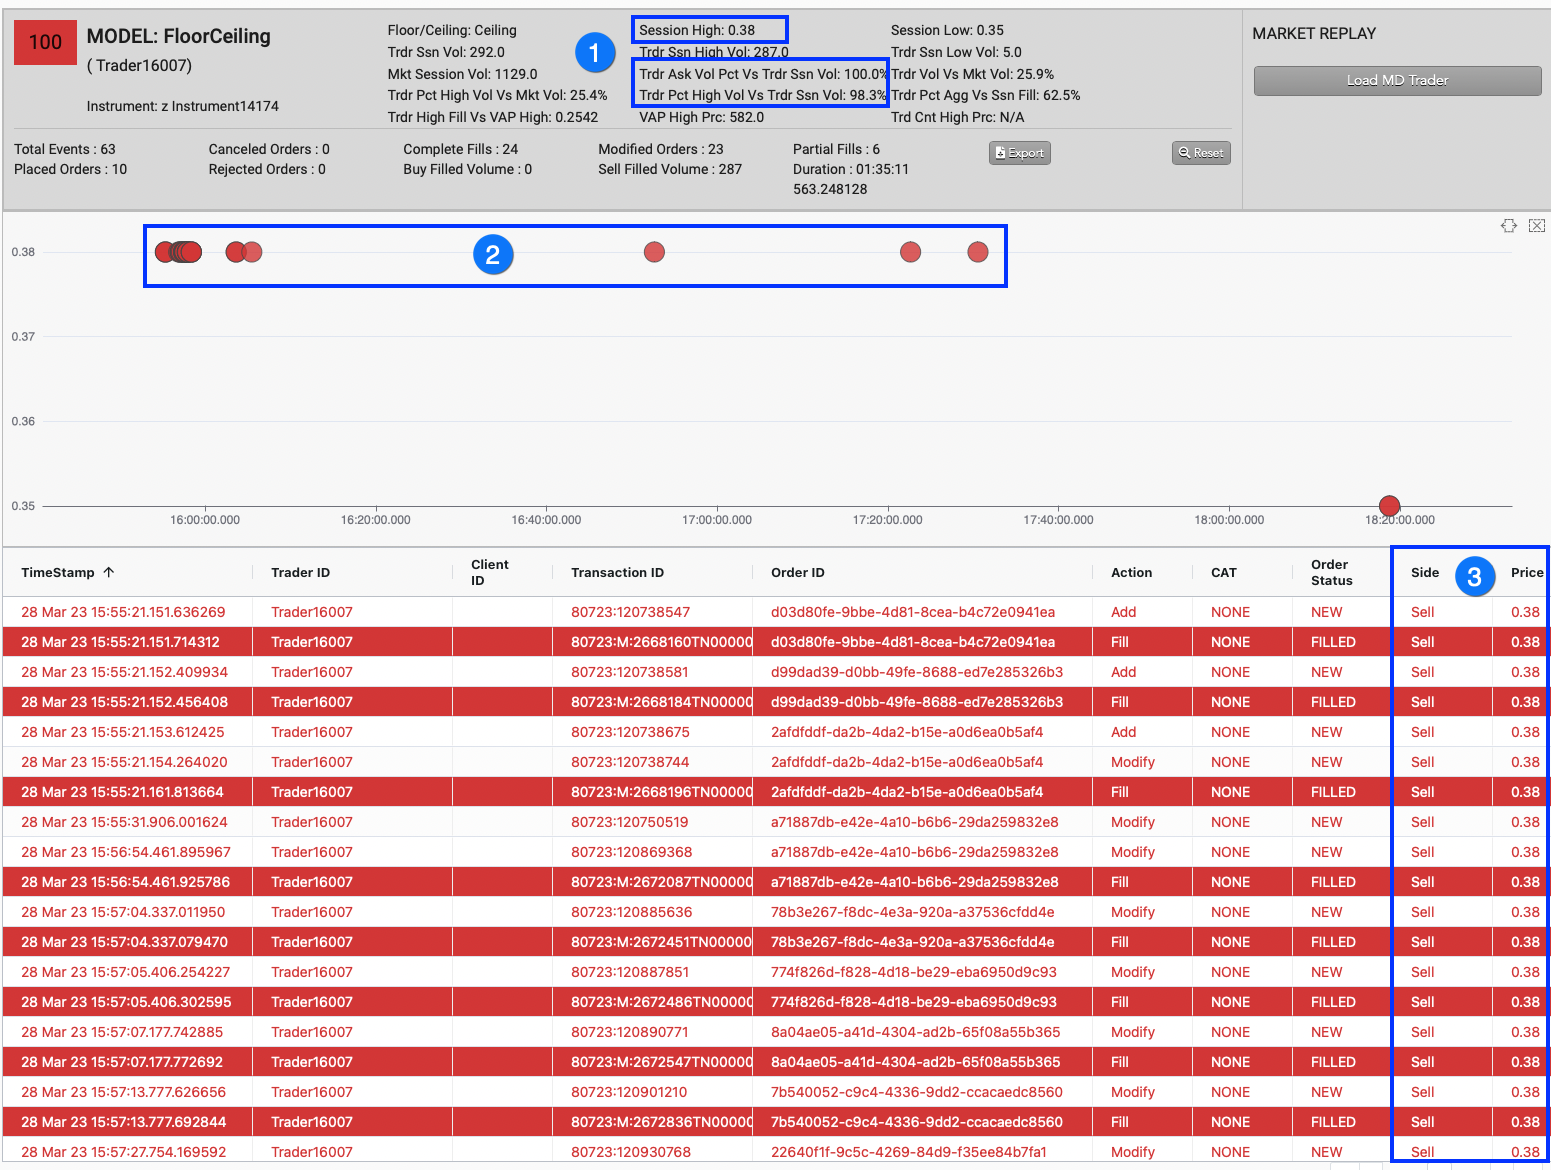
    In addition to the scorecard metrics, the Floor/Ceiling chart and audit trail can also help identify suspicious
    trading activity. The following image shows results from inspecting a Floor/Ceiling trading cluster.

    When investigating Floor/Ceiling clusters in TT Trade Surveillance, check for the following indications of potential price
    manipulation:

    1. Compare the trader’s ask/bid volume percentage and the percent high/low volume with the session volume.
    2. In the chart, look for a high number of trades on one side (bid/ask) of the market that matches the Session
      high/low price level.
    3. In the audit trail, check if the trades occurred at the high/low price for the instrument.

    Front Running

    Front Running is an attempt to leverage insider knowledge of a future transaction to benefit from the impact to an instrument’s price. For example, a trader may submit their own trades before or after submitting a larger trade for one of their clients. The trader then benefits from the change in price due to the client’s trade.

    The Front Running model detects an outlier point in time where significant changes in volume and price occur. From this point in time, the model can determine if a company’s trader(s) benefited from the outlier event earlier and/or later in the trading session.

    Front Running scoring methodology

    To detect potential Front Running, TT Trade Surveillance identifies minute bars where market volume exceeds a set percentile threshold (using all minute bars for that instrument in the clusters session) while the price of the instrument also moves significantly during the same minute. These outlier bars are indicated with a thin black outline of the green market volume bar in the chart. Minute candles are also displayed on the same chart and are lined up with the bar volumes of their respective minutes.

    The Front Running model then determines if the company submitted a high portion of the volume during the outlier event, indicating that the company’s trading was a driver of the volume and price move outlier. Next, the model looks at different features of the company’s trading before, during and after the outlier, such as potential profit, aggressiveness and total price move to help inform the scoring.

    The Front Running score is based on a sliding scale between 0-100. For example, a cluster score of “75” indicates that the company had trades that seemed to benefit from a larger outlier event.

    Front Running scorecard metrics

    The Scorecard Metrics section measures the following statistics related to
    Front Running:

    • acct_clust_sum_fillVol: The total buy and sell fill volume for the entire cluster, list by trading account.
    • comp_clust_count_traderAcct: The number of trader/account combinations that appear within the cluster.
    • comp_clust_pct_mktVol_on_aggr_side: The company’s percentage of the market (candle) volume on the “aggressive” side of the market (i.e., the side getting filled in with more liquidity-taking trades).
    • comp_clust_pct_vol_aggr_flagged: The company’s percentage of volume flagged as aggressive.
    • comp_clust_sum_mktVol: The company’s total sum of the market (candle) volume.
    • comp_outlierBar_pct_mktVol: The company’s percentage of market (candle) volume during the outlier event.
    • comp_sod_num_position: The company’s start-of-day position as calculated by TT Trade Surveillance.
    • mkt_outlierBar_delta_ticks: Outlier event’s price change, listed in ticks.
    • trader_clust_sum_fillVol: The total sum of filled buy and sell volume listed by trader.
    • trader_prepos_pct_mktVol: The trader’s percentage of market volume in the pre-positioning phase.
    • traderAcct_clust_sum_fillVol: The total sum of filled buy and sell volume listed by trader/account.

    Identifying Front Running

    The Front Running model displays all large volume events as green candles. The outlier event displays as a green candle surrounded by a thin black box. The model also displays the relevant trades as blue dots for buys and red dots for sells. The model connects the relevant trades to the outlier event using a light blue line to highlight the connection.

    When investigating Front Running clusters with TT Trade Surveillance, consider the
    following:

    • The activity highlighted in the outlier event.
    • The aggressive score of trading activity before and after the outlier event.

    Using the
    Cluster Scorecard, you
    can analyze the activity that triggered the high cluster score. The highlighted outlier event provides visual clues about the potential suspect
    trading pattern. The audit trail data on the scorecard can be used to verify
    order information and timing of the activity. The following example shows
    trading activity identified as potential Front Running.

    In this example:

    1. The outlier event shows a high volume of buy orders that causes an increase the instrument’s price.
    2. Prior to the outlier event, the trader filled a number of buy orders at a lower price.
    3. Following the outlier event, the trader filled a number of sell orders at the higher price.

    Influencing the Open

    The Influencing the Open model detects indirect wash trades that occur before open trading in violation of exchange rules, and looks for patterns of submitted and canceled orders that may be attempts to manipulate the indicative open price during the Pre-Open trading period.

    The model is designed to identify disruptive trading practices during Pre-Open trading as defined by the CME Group.

    Scoring methodology

    When scoring clusters, the Influencing the Open model analyzes the following trading activity during the Pre-Open trading period:

    • Potential indirect wash trades
    • A large volume of submitted and canceled orders.
    • Submitted and canceled orders at off-market prices.

    Score interpretation

    The score assigned to a cluster is based on a sliding scale between 0-100 using a weighted calculation. A score of 75 and above is a good indication that the suspect trading activity occurred.

    Based on TT Trade Surveillance best practices, clusters that score over 75 are deemed to be “high risk” and should be the primary focus of users during their compliance reviews.

    Scorecard metrics

    The Influencing the Open cluster scorecard metrics can help you determine if price manipulation may have occurred during the Pre-Open trading period.

    The scorecard metrics are gathered during the following market states:

    • Pre-Open — Earliest phase of the Opening market state. Orders can be added, modified, and canceled, and no matching occurs. Accepted orders are used to determine the indicative open price for the instrument.
    • No Cancel — The end of the Pre-Open phase prior to open trading. Orders can be added but not modified or canceled, and no matching occurs. Accepted orders are used to determine the indicative open price for the instrument.
    • Opening — A brief intermediate state. Pre-Open orders are resolved following indicative open price determination.
    • Open — Regular trading hours and the start of continue trading. Orders can be added, modified, and canceled, and matching occurs.

    The following metrics are provided:

    • PreOpen Place to Cancel Ratio — The percent of the trader’s submitted orders that were canceled during Pre-Open.

    • Trader Vol PreOpen Vs NoCancel — Shows the percentage of the trader’s volume that was not canceled prior to regular trading hours.

    • First Mkt Fill Price at Open — Displays the price of the first fill in the market at the Open.
    • Traders Fill Price at Open — Displays the price of the trader’s first fill during regular trading hours.
    • Trader Fill Vol at Open — Shows the trader’s total volume at Open.

    • Traders Avg Order Size in PreOpen — Average size of orders submitted during Pre-Open.
    • Traders Avg Order Size in Session — Average size of orders submitted during the regular trading hours session.
    • Traders PreOpen Vs Session Orders — The ratio of the trader’s PreOpen and regular trading hours volume.
    • Traders Fill Volume Session — The trader’s filled volume during regular trading hours.
    • Traders Place Volume Session — The trader’s submitted order volume during regular trading hours.
    • Traders Fill Vs Place Ratio Session — The ratio of submitted order volume to filled volume during the regular trading hours session.
    • Indirect Wash Trade — Indication of an indirect wash trade: True or False.
    • Open Orders No Fill — Indication of unfilled working orders during regular trading hours: True or False.
    • PreOpen Modify Count — Total number of changed working orders during Pre-Open.
    • PreOpen Cancel Count — Total number of canceled orders during Pre-Open.
    • Indicative Opening Prices — A list of all indicative open prices provided by the exchange and their related timestamps during Pre-Open.

    Analyzing data for Influencing the Open

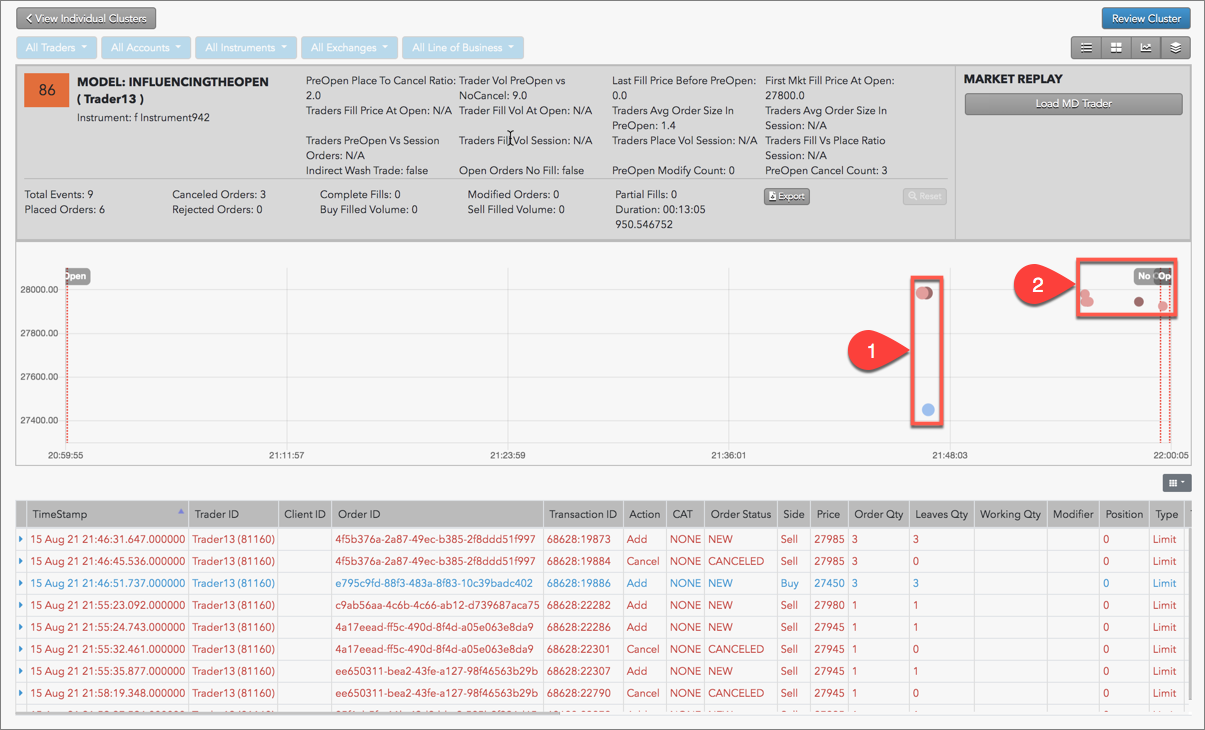
    In addition to the scorecard metrics, the chart and audit trail on the scorecard can also help identify suspect Identifying the Open trading activity. The following images show results from inspecting clusters for this model.

    The example above shows the following:

    1. The same trader submitted Buy and Sell orders for the same instrument, which may be an indication of an indirect wash trade during the Pre-Open trading period.
    2. The example also shows that the trader submitted and canceled multiple orders during Pre-Open, which may be an indication that the orders were never meant to be exposed to the market and were only submitted to increase volume for the instrument being traded.

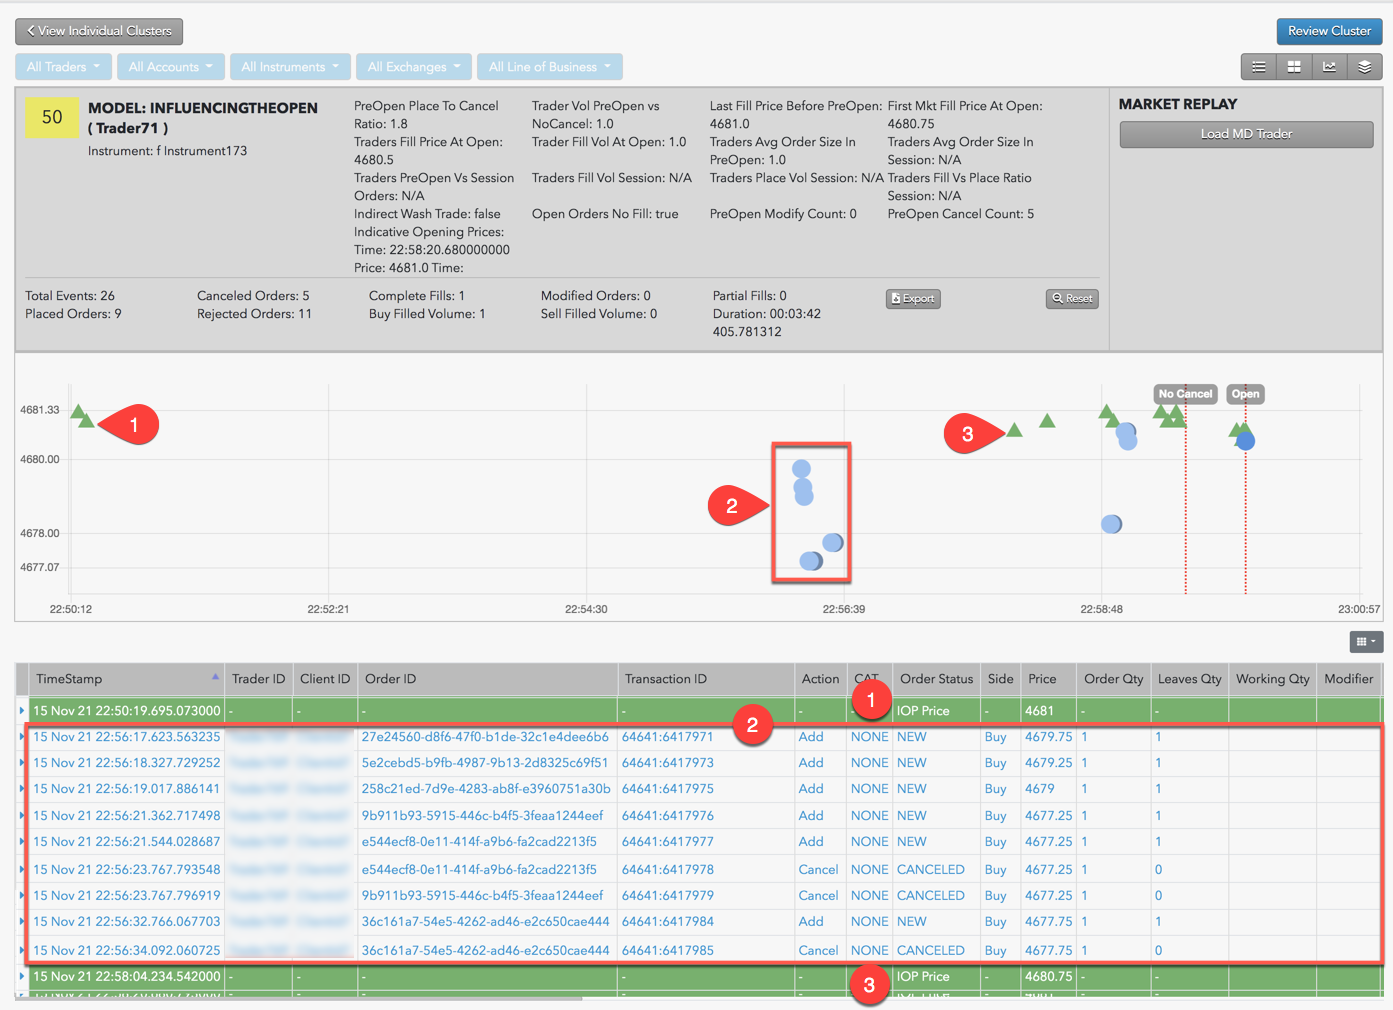
    This next example shows how the chart and audit trail for the Influencing the Open model displays indicative open prices.

    In this example:

    1. The exchange displays an indicative open price during their Pre-Open market state.
    2. The same trader submitted and canceled multiple orders during Pre-Open, which may be an indication that the orders were not entered for the purpose of being filled but were submitted for the purpose of altering the indicative open price.
    3. The exchange displays an updated indicative open price based on the latest trading activity during Pre-Open.

    Marking the Close

    Marking the Close is a pattern of trading activity intended to manipulate the settlement price of an instrument during its settlement period. The Marking the Close beta model in TT Trade Surveillance detects potential settlement price manipulation in select CME outrights and spreads, and identifies on-exchange activity during settlement periods that may have influenced the settlement price for the most commonly traded CME products.

    Note: TT Trade Surveillance highlights suspicious trading for both spreads and outrights in the same product. Some multileg instruments can impact the settlement price of its outrights depending on the type of instrument or the expiration months involved.

    Scoring methodology

    To detect a trader’s potential Marking the Close trading activity, TT Trade Surveillance analyzes the following data during the settlement period:

    • The price of an instrument before settlement and its eventual settlement price.
    • Orders that comprise a large percentage of orders in the market.
    • Trades that occurred mostly on the same side of the market.
    • A trader’s activity during the settlement period in proportion to their activity during the entire trading session.
      • The model scores whether the trader is supplying or taking liquidity during the settlement period, giving higher scores for clusters where they are aggressively trading and lower scores for when they are mostly being filled passively.
      • Higher scores are also given to a trader who has higher percentages of the total market volume during settlement.

    Score interpretation

    The score assigned to a cluster is based on a sliding scale between 0-100 using a weighted calculation. A score of 75 and above is a good indication that the suspect trading activity occurred.

    Based on TT Trade Surveillance best practices, clusters that score over 75 are deemed to be “high risk” and should be the primary focus of users during their compliance reviews.

    Scorecard metrics

    The Marking the Close cluster scorecard includes metrics that help you determine if price manipulation may have occurred during the instrument’s settlement period.

    The following metrics are provided:

    • Stlmt Price — The daily settlement price reported by the exchange.

    • Trader Vs Session — This is the percent of the trader’s total activity for the day that occurred during the instrument’s settlement window. A high percentage of activity by the trader during the small settlement window may indicate a trader targeted the settlement window in an attempt to affect the settlement price.

    • Vol Vs Market — Shows the trader’s settlement volume as a percentage of the total settlement volume. A higher percentage of volume may indicate that the trader’s activity had a greater impact on the eventual settlement price.

    • Stlmt Period Buy/Sell Fills — Displays the VWAP of the fills on the suspect side of the market: buy fills for upward price movement over the settlement price, or sell fills for downward price movement below the settlement price.
    • Stlmt Period Vs Stlmt Price — Shows the last market price of the instrument prior to the settlement period compared to the settlement price. This gives you an approximation of how much the price moved up or down during the settlement period. Calculated as a ratio of settlement price before/during the settlement period.

    • Buy Fills Percentage — Displays the percent of fills that the trader had on the buy side of the market during settlement. Note that a “1” indicates that all of the trader’s fills were on the buy side, while a “0” indicates that the trader only had fills on the sell side.

    • Stlmt Start Time — The Settlement start time and end time set and published by the exchange. Fills that occurred during this time window are typically used to calculate the settlement price of an instrument or related product.

    • Stlmt End Time — The Settlement start time and end time set and published by the exchange. Fills that occurred during this time window are typically used to calculate the settlement price of an instrument or related product.
    • Trader Volume — Total trader volume during settlement. A high total volume may indicate that the trader’s activity had a greater impact on the eventual settlement price.
    • Market Volume — Total market volume during settlement.
    • Last Market Price — The last market price prior to the settlement period.
    • Trader VWAP — The trader settlement period VWAP.
    • Ticks Chg During Stlmnt — Number of ticks between the last market price and the settlement price.
    • Ticks Chg VWAP vs Stlmnt — The number of ticks difference in price movement between VWAP and settlement.
    • Aggrssr Fills Pct of Stlmnt Fills — The percentage of fills during settlement that are aggressing order fills.
    • Marking Up — Displays either “True” or “False”.

    Identifying Marking the Close

    In addition to the scorecard metrics, the Marking the Close chart and audit trail can also help identify Marking the Close trading activity. The following image shows results from inspecting a Marking the Close trading cluster.

    When investigating Marking the Close clusters in TT Trade Surveillance, check for the following indications of potential price manipulation:

    1. In the chart, look for a high percentage of buys above the settlement price or sells below the settlement price within the settlement period. You can move the cursor over suspect trading markers between the settlement period start and end times to view the price, quantity, and time of the trade.
    2. In the audit trail, check if the fills were for aggressive orders entered during the pre-close settlement period or passive orders resting in the market before or during the settlement period. Click a row in the audit trail to expand it and view additional order and fill details.

    Momentum Ignition

    Momentum ignition trading patterns attempt to create directional price movement and then to capitalize on the result. Typically, momentum ignition is identified by a series of aggressive orders submitted in a short time span in an attempt to trigger resting stop orders, which then cause pre-placed orders to be executed at a profit by the ignited price movement.

    Scoring methodology

    To detect potential momentum ignition, TT Trade Surveillance searches for specific patterns of fill activity by the same trader who submitted the aggressive orders. It looks for traders who place multiple orders that immediately lift offers or hit bids within a short time frame (called aggressive orders). For each of these aggressive orders, TT Trade Surveillance identifies fill prices for orders executed at multiple price levels and whether the changing fill prices trend in same side as the aggressive orders. Finally, it determines whether a fill was received too quickly on the opposite side of the market from the aggressive orders.

    Score interpretation

    The score assigned is based on a sliding scale between 0-100, based on the relationship between the aggressive order fill quantities and the profit-taking order fill quantities.

    Scorecard metrics

    The Scorecard Metrics section measures the following statistics related to momentum ignition:

    • Ignitier Price Levels: Number of price levels at which the aggressive orders were filled. The sequence of price levels at which fills occur correspond to the movement in market price (i.e. Buy orders at increasing price levels that contribute to an increase in market price).
    • Ignites (Vol): Fill volume for the “aggressive” orders (bids that immediately lift offers or offers that immediately lift bids within) within a time frame.
    • Opp. Side (Vol): Volume of fills received on the opposite side of the market from the aggressive order within a time frame.

    For example, if the Igniter Price Levels and the Ignites (Vol) metrics display large values, this indicates that the trader may have been attempting to ignite a price movement in a particular direction (buy or sell) in order to mislead other market participants or to create an artificial price. The Opp. Side (Vol) is a good indicator of whether or not the trader received advantageous fills on orders opposite the igniter orders that the trader would not have otherwise received without intentionally or recklessly sparking the price movement.

    Identifying momentum ignition

    When investigating Momentum Ignition clusters with TT Trade Surveillance, you should focus on the:

    • Number of distinct price levels used by aggressive orders.
    • Quantity filled on the aggressive orders.
    • Quantify filled on the opposite, or profit-taking, orders.

    Use the Cluster Scorecard to get a closer look at the activity that triggered the high cluster score. The pressure chart on the scorecard provides visual clues about the potential suspect trading pattern. The order audit trail data on the scorecard can then be used to verify order information and timing of the activity. The following example shows trading activity identified as potential Momentum Ignition.

    In this example:

    1. Multiple aggressive Sell orders are submitted and filled in a short time span at the best Bid price.
    2. The orders ignite a price movement and the same trader receives a Buy fill on the same side of the market.

    The activity can then also be replayed on the Ladder view tool and viewed on the Macro view. For example, you can click Market Replay to show how the orders interacted with the market at the various price levels.

    In this example:

    1. The price ladder shows the prices and liquidity in the market during the suspect trading activity.
    2. The vertical line identifies the point of time during the market replay.
    3. Orders and fills that occurred around the specified time during the market replay are shown in the audit trail.

    Pinging

    Pinging involves entering small orders to discover hidden book depth followed by a series of order actions designed to force the large order to trade at less desirable prices.

    Scoring methodology

    To detect potential pinging, TT Trade Surveillance looks for one or more series of small FOK (Fill Or Kill) orders (pings). After identifying a fill for a small quantity FOK order, TT Trade Surveillance looks for a large order on opposite side of market that executes at a worse price than the ping FOK, which is then followed by an even larger execution on the original ping order side to take advantage of the market move.

    Score interpretation

    At a high level, the risk score for pinging is determined on a sliding scale of 0-100, based on the following factors:

    • The number of pings increases the risk score.
    • Larger sums of order quantities, excluding FOK orders and Place orders, increases the risk score.
    • Higher totals of fill quantities for FOK orders reduces the risk score.

    Scorecard metrics

    The Scorecard Metrics section measures the following statistics related to pinging:

    • Number of pings: Number of small (or ping) orders in the cluster.
    • Pings Quantity: Size of the ping orders used.
    • Opposite side quantity: Quantity of the order that followed the executed ping order on the opposite side of the market.

    Identifying pinging

    Use the Cluster Scorecard to get a closer look at the activity that triggered the pinging score, focusing on the audit trail:

    • Review the audit trail for the creation of a series of small new orders at various price levels followed by almost immediately by cancel events.
    • Look for a change in trader behavior once the small orders begin to fill immediately after order entry. Specifically, look for larger aggressively priced orders being entered on the opposite side of the market (as the small orders) as soon as the small orders get filled. The use of a hyper-marketable limit order or a market order could be indicative of aggressive orders.
    • Look in the audit trail to see if that aggressive order was filled and was followed by an even larger order on the same side of the market as the original small orders were placed.
    • Compare the fill price of the final large order to that of the fill of the last small ping order. If the final large order filled at a better price than the original small ping orders, then it is more likely that an abusive pinging occurred.

    Price Ramping

    Price ramping is an attempt to create directional price movement. The Price Ramping model can detect a series of aggressive orders submitted in a short time span that trade through multiple price levels on the same side of the market.

    Price Ramping scoring methodology

    To detect potential price ramping, TT Trade Surveillance searches for specific patterns of fill activity by the same trader who submitted the aggressive orders. It looks for traders who place multiple orders that immediately lift offers or hit bids within a short time frame (aggressive orders). For each of these aggressive orders, TT Trade Surveillance identifies fill prices for orders executed at multiple price levels and whether the changing fill prices trend in same side as the
    aggressive orders.

    The Price Ramping score is based on a sliding scale between 0-100. For example, a cluster score of “75” indicates that many aggressive orders were filled at multiple price levels.

    Price Ramping scorecard metrics

    The Scorecard Metrics section measures the following statistics related to price ramping:

    • Ramping Price Levels: Number of price levels at which the aggressive orders were filled. The sequence of price levels at which fills occur corresponds to the movement in market price (e.g., Sell orders at decreasing price levels that contribute to a decrease in market price).
    • Ramping Side: Indicates which side of the trade the ramping occurred (Buy or Sell).
    • Aggressor Fill Qty: The quantity of aggressive order fills. Note: Applies to exchanges that have an aggressor fill tag.
    • Fill Qty: Ramping fill quantity.
    • Aggressor Fill Percentage: The percentage of trader volume that filled aggressively. Note: Applies to exchanges that have an aggressor fill tag.
    • Buy Fill Ratio: The ratio of Buy fills to total fills.
    • Buy Fill Ratio: The ratio of Sell fills to total fills.
    • VWAP Buy: The average traded price of an instrument based on Buy volume and price.
    • VWAP Sell: The average traded price of an instrument based on Sell volume and price.
    • Ramping Prices: The list of fill prices in ascending or descending order.

    Identifying Price Ramping

    If the Price Ramping model displays multiple price levels for a cluster, this may indicate that the trader is attempting to ignite a price movement in a particular direction (Buy or Sell) to mislead other market participants or create an artificial price.

    When investigating Price Ramping clusters with TT Trade Surveillance, consider the following:

    • The number of price levels with aggressive orders.
    • The side and fill quantity of each aggressive order.

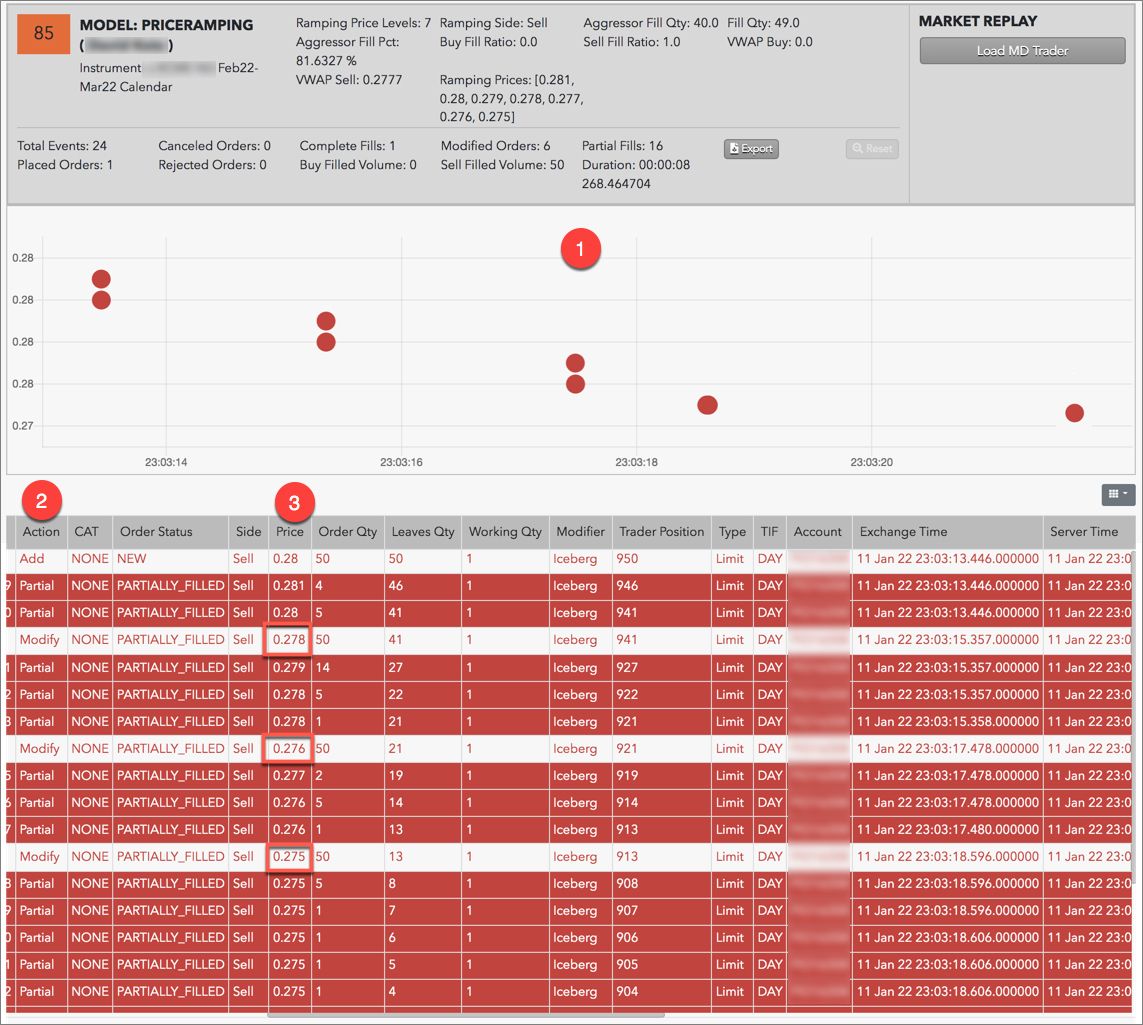
    Using the Cluster Scorecard, you can analyze the activity that triggered the high cluster score. The pressure chart on the scorecard provides visual clues about the potential suspect trading pattern. The audit trail data on the scorecard can be used to verify order information and timing of the activity. The following example shows trading activity identified as potential price ramping.

    In this example:

    1. The pressure chart shows multiple price levels ramping down on the Sell side.
    2. The “Action” column in the audit trail shows that multiple aggressive Sell orders were partially filled in a short time span.
    3. The “Price” column shows the aggressive Sell orders were placed below the market as the price was moving lower
      (e.g., .278, .276, .275).
    Privacy Overview

    This website uses cookies so that we can provide you with the best user experience possible. Cookie information is stored in your browser and performs functions such as recognising you when you return to our website and helping our team to understand which sections of the website you find most interesting and useful.

    Strictly Necessary Cookies

    Strictly Necessary Cookie should be enabled at all times so that we can save your preferences for cookie settings.

    Analytics

    This website uses Google Analytics to collect anonymous information such as the number of visitors to the site, and the most popular pages.

    Keeping this cookie enabled helps us to improve our website.

    Marketing

    This website uses the following additional cookies:

    (List the cookies that you are using on the website here.)