





The processing statistics report shows the quantity and type of data processed by TT Trade Surveillance over a selected period of time for your company. Processing data can be included per surveillance model, trader, account, instrument, and TT source.
To generate a Processing Statistics report:
- On the Trade Surveillance dashboard, select the Reports tab and click Generate Report.
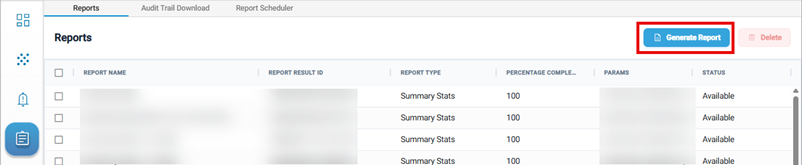
The Report Configuration panel is displayed on the right side of the screen. - Select Processing Stats in the Report Type field in the Report Configuration panel.

- Enter data for the following Inputs fields in the panel:
- Name – Enter a name for your report.
- Date — Sets the time period for reporting the statistics.
- Include Account Stats — Includes processing stats on a per account basis. This setting is optional.
- Detail Categories — Generates processing statistics for a specific category of data. Select one of the following:
- Model: Shows statistics per problematic trading model.
- Trader: Shows stats per trader in your company.
- Source: Includes processing stats for specific TT components.
- Instrument: Includes statistics per instrument traded by your company.
- Click Generate Report.The report is displayed on the screen.

The report includes the following columns:- Processing Stat — Lists the type of processing statistics. The column appears in the “Processing Results Overview” at the top of the report, the “Company Processing Results” section, and per account if included.
- Value — Shows the amount of clusters or ledger records processed, and the time (ms) and duration of each process.
- Clusters (0-100) — The total number of clusters processed by a surveillance model or TT service.
- Ledger Records — The total number of records in Ledger that were processed by a surveillance model or TT source.