Trade
Overview
TT Platform
Description
Task
Browser Access
Description
Task
Videos
TT Desktop
Description
Task
Videos
Reference
Workspace Windows
Description
Task
Videos
Widgets
Description
Task
Preferences
Description
Viewing Market Data
Time and Sales
Task
Reference
Description
Depth
Description
Task
Reference
Market Grid
Description
Task
Videos
Reference
Product Grid
Description
Task
Reference
Spread Matrix
Description
Task
Videos
Reference
Position in Queue (PIQ)
Basic Order Entry
TT Order Types
Description
Task
Videos
Reference
Case Studies
TT Premium Order Types
Description
Task
Reference
Order Ticket
Description
Task
Use Cases
Reference
MD Trader®
Description
Task
Videos
Reference
Order Profiles
Description
Task
Reference
Routing Rules
Description
Task
Blocktrader
Description
Task
Videos
Reference
Trading Crypto on TT
Description
Task
Videos
Reference
Trading on B3
Order Management
Order Book
Description
Task
Reference
Floating Order Book
Description
Task
Reference
Fills
Description
Task
Reference
Positions
Description
Task
Reference
Orders and Fills
Description
Task
Reference
Audit Trail
Description
Task
Reference
Audit Query
Description
Task
Reference
Account List
Description
Task
Videos
Reference
Position Manager
Description
Task
Reference
Alert Manager and Alert Viewer
Description
Task
Videos
Reference
Account & User Restrictions
Description
Task
Reference
Balances
Description
Task
Reference
TT® OMS
Care Orders
Description
Task
Videos
Reference
Lock and Release
Description
Task
Bulking
Description
Task
Videos
Stitching and Splitting
Description
Task
Combining
Description
Task
Order Passing
Description
Task
Use Cases
Order Exceptions
Description
Task
Options
Options Risk
Description
Task
Videos
Reference
QuikStrike
Description
Task
TT Uncovered 3.0
Description
Task
TT Uncovered 2.0
Description
Task
Volatility Calculator
Description
Task
Expiration Manager
Description
Task
Watchlist
Description
Task
Videos
Reference
Options Risk Matrix
Description
Task
Videos
Reference
Options on TT
Description
Videos
Strategy Creation
Description
Task
Use Cases
Reference
Counterparty Manager
Description
Task
RFQ with Counterparties
Description
Task
RFQ Viewer
Description
Task
Videos
Reference
Electronic Eye
Description
Task
Videos
Reference
Vol Curve Manager
Description
Task
Use Cases
Videos
Reference
Options Trade Monitor
Description
Task
Videos
Reference
Options Chain
Description
Task
Use Cases
Videos
Reference
Spread Trading
Autospreader
Description
Task
Use Cases
Videos
Reference
Autospreader Rules
Description
Task
Videos
Reference
Hedge Manager
Description
Task
Videos
Reference
Trading in Yield
Description
Task
Use Cases
Reference
Aggregator
Description
Task
Videos
Reference
Algo Trading
Algo Dashboard
Description
Task
Videos
Reference
Template Manager
Description
Task
Order Management Algos (OMAs)
Autotrader
Description
Task
Reference
Videos
Excel integration with TT
Description
Task
Videos
Reference
Market-Making Algos
Analytics
Charts
Description
Technical Indicators
Task
Videos
Reference
Trader Analytics
Description
Task
Reference
ADL
ADL Overview
Introduction to ADL
Description
Task
Videos
Reference
ADL Basic Concepts
Description
Task
Reference
Building your first algo
Lessons
Advanced concepts
Description
Task
Case Studies
Jump blocks
Group blocks
Virtualized blocks
Library blocks
Trading Blocks
Discrete blocks
Arithmetic blocks
Basic blocks
Logic blocks
Miscellaneous blocks
Setup
Setup Overview
Getting Started
Description
Task
Videos
Reference
Supported Order Types and TIFs
Company Administration
Connections
Description
Task
Videos
Reference
Accounts
Description
Task
Videos
Use Cases
Reference
Users
Description
Task
Videos
Reference
Company
Description
Task
Reference
Order Tag Defaults
Description
Task
Account Administrators
Description
Task
TT Premium Services
Description
Task
TT Access
Description
Task
Advanced Features
Description
Risk Management
Risk Administration
Description
Task
Risk Limits
Description
Task
Videos
Reference
Pre-Trade Portfolio Risk
Description
Task
Reference
Order Cross Prevention
Description
Task
Videos
KRM Limits
Description
Task
TT® OMS
TT OMS Administration
Description
Task
Use Cases
Reference
Exchanges: Americas
FMX
Description
Task
NFI
Task
Nodal
Description
Task
MX
Description
Task
MIAX_FUT_NY
Description
Task
MIAX_FUT_CH
Description
Task
MexDer
Description
Task
ICE
Description
Task
Goldman Sachs Commodity Blocks (GSCB)
Description
Task
Referece
FMX_USTF
Description
Task
B3
Description
Task
Fenics
Description
Task
EBS Market
Description
Task
EBS Direct
Description
Task
Dealerweb
Description
Task
CME
Description
Task
CFE
Description
Task
Cboe FX
Description
Task
Reference
CBOE
Description
Task
Exchanges: EMEA
ICE_L
Description
Task
WSE
Description
Task
Nord Pool
Description
Task
Reference
NASDAQ_NED
Description
Task
NDAQ_EU
Description
Task
MEFF
Description
Task
LSE
Description
Task
LME NTP
Description
Task
LME
Description
Task
JSE
Description
Task
ATHEX
Description
Task
GFO-X
Description
Task
Euronext
Description
Task
Eurex
Description
Task
Videos
Eris
Description
Task
EPEX SPOT
Description
Task
Reference
EEX
Description
Task
DGCX
Description
Task
BIST
Description
Task
Exchanges: Asia/Pacific
ABX
Description
Task
ASX
Description
Task
FEX
Description
Task
HKEx
Description
Task
JPX
Description
Task
NSE
Description
Task
NZX
Description
Task
SGX
Description
Task
SGX GIFT
Description
Task
TAIFEX
Description
Task
TFEX
Description
Task
TFX
Description
Task
CoinFLEX
Task
Exchanges: Crypto
Coinbase
Description
Task
Kraken
Description
Task
FIX Support
FIX Ruleset
Description
Task
FIX Sessions
Description
Task
Secondary Accounts
Description
Task
Monitor
TT Mobile
TT Backtesting
APIs
TT REST API 2.0
Getting Started
API Reference
TT REST API 2.0 (UAT)
Getting Started
API Reference
TT .NET SDK
Getting started with TT .NET SDK
Creating the application framework
Working with instruments
Subscribing for market data
More about prices
An in-depth look at the Price class
Working with orders and fills
Handling trade subscriptions
Working with trade subscriptions
Working with Algos
Algo Server
TT Order Types
TT Premium Order Types
Advanced Concepts and Options
Appendix
TT CORE SDK
Getting Started with TT Core SDK
Creating Application Framework
Working With Instruments
Subscribing for Market Data
Working with Orders and Fills
Creating a TT Application Server
Appendix
TT Trade Surveillance
Overview
Using TT Trade Surveillance
Cluster View
Core Models
Market Abuse Models
Cross Product Models
Spoofing Models
Improperly Matched Trade Models
Market Rate Models
Trading Behaviors Models
Miscellaneous Models
Configurable Models
Reports
Reference
TT FIX Services
TT FIX General
Getting Started
FIX Message Structure
Session messages
TT FIX Order Routing
Overview
TT FIX message conversations
Supported application messages
TT FIX Market Data
Overview
TT FIX message conversations
Supported application messages
TT FIX Drop Copy Out
Overview
TT FIX Message Conversations
Supported application messages
Compliance Feed messages
TT FIX Drop Copy In
Overview
Supported application messages
TT FIX Gateway
Getting Started
FIX Message Structure
Components
Session messages
Price Gateway Messages
Order Gateway Messages
TT FIX Recovery
Overview
FIX Recovery Methods
Supported application messages
Compliance Feed Messages
MiFID II Support

Accessing TT Trade Surveillance

TT Trade Surveillance provides you the ability to analyze your own trading activity for potential regulatory concerns. Users can also be given administrator-level permissions to view the activity of all users on the accounts to which they have access or all users across an entire company.

Logging in to TT Trade Surveillance

To log in to the TT Trade Surveillance from any supported browser

Administrator and User Permissions

In Setup, there are administrator-level and user-level permission settings on the Users | Permissions tab:

How TT Trade Surveillance Works

TT Trade Surveillance analyzes daily audit log data to identify patterns of activity similar to confirmed examples of problematic trading activity. Each of these patterns is referred to a model. From these models, TT Trade Surveillance generates a variety of metrics that help highlight potential areas of concern.

  • For each model, TT Trade Surveillance groups all audit log data into “clusters” of sequential trading events likely related to a specific action or series of actions by the trader.
  • For problematic trading patterns investigated using a machine learning algorithm, each cluster is analyzed for a number of characteristics, or “features.” Based on their similarity to trading patterns from known regulatory cases, the algorithm generates a single risk score.
  • For problematic trading patterns investigated using parameter threshold-based methods, each cluster is analyzed for specific metrics and is assigned a numeric score. Based on the type of metric, the score can indicate whether the cluster of activity passed or failed the metric or how far away from a metric’s acceptable parameters the cluster activity deviates.

What is a cluster?

A cluster is a sequential series of logged activity from a trader’s audit trail. These clusters are segmented based upon factors such as time, trader, financial instrument and proximity of other order actions. They can vary in length from a fraction of a second to a few minutes long and contain every recorded action by a trader.

Cluster analysis – Machine Learning
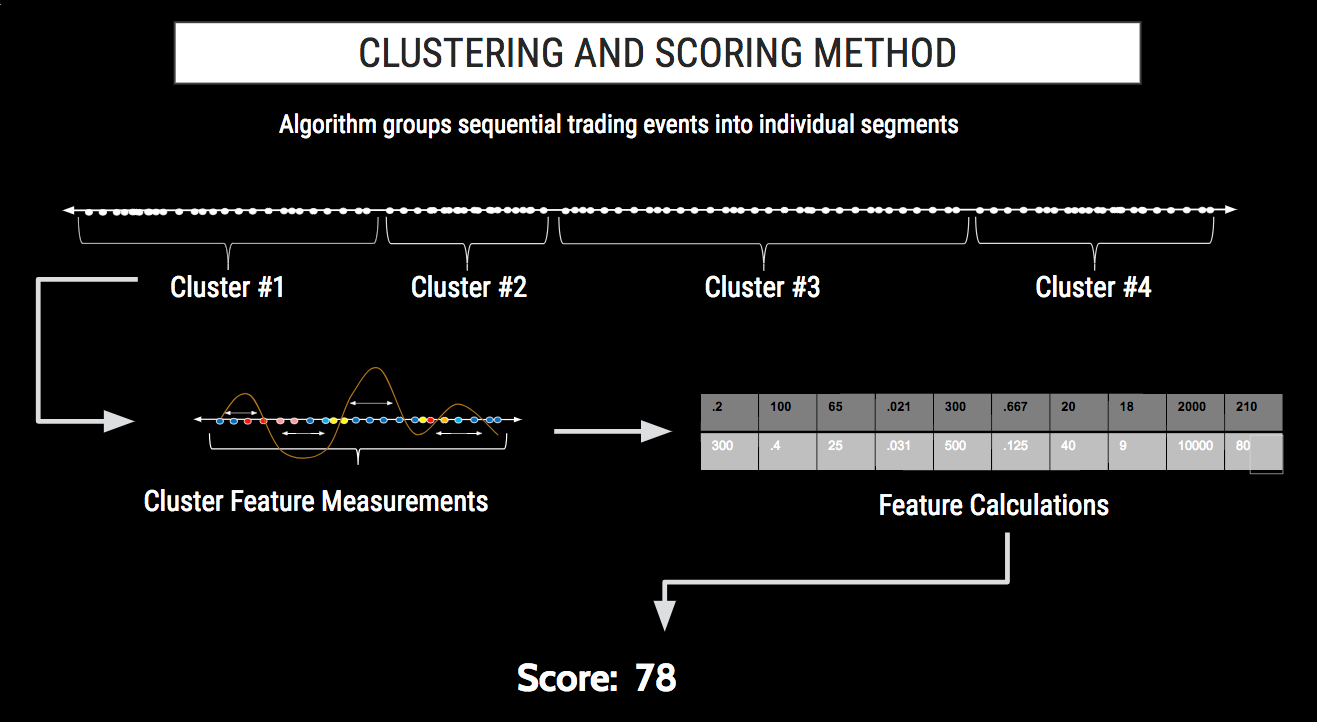
For problematic trading patterns investigated using machine learning, the machine learning algorithm analyzes each cluster and extracts characteristics called “features,” such as the number of canceled orders or the ratio of one action to another. The algorithm builds a collection of over 30 different features and then compares this combination of features to known problematic trading patterns, such as spoofing.

The various comparisons of a cluster’s features to the characteristics of known problematic trading patterns are given a numeric score. These scores are weighted, based on the likelihood that the score indicates problematic activity. The aggregation of these individual weighted scores are used to generate a single risk score on a 0 to 100 scale for every cluster.

Cluster analysis – Parameter Thresholds

For problematic trading patterns investigated using parameter thresholds, characteristics of clusters are measured and compared to benchmarks, such as time between orders or the number of canceled orders. For trading patterns where simply exceeding a threshold indicates the possibility of problematic activity, a pass/fail score is assigned to the cluster as either 0 or 100. Where the degree to which a cluster exceeds a threshold must be evaluated, a score between 0 and 100 is generated to indicate how far beyond a threshold the cluster was measured.


Introduction

TT Trade Surveillance is a trade surveillance tool that uses pattern recognition based on machine learning to identify trading behaviors that pose the greatest regulatory risk to your firm. It scores all activity based on similarity to actual regulatory cases such that compliance officers can identify risk, prioritize work and address problematic trading behavior.

TT Trade Surveillance is an integrated component of the TT platform that requires no implementation or integration and can simply be activated in Setup. Through the TT platform, TT Trade Surveillance has immediate access to trading data. TT Trade Surveillance also lets users with order and fill data from outside the TT platform import their data into TT Trade Surveillance through the TT FIX Inbound Drop Copy service.

TT Trade Surveillance features a number of data visualizations and filters to assist in the review and evaluation of trading activity and provides the ability to record dispositions.

TT Trade Surveillance surveillance models

TT Trade Surveillance uses the following models to analyze data for problematic trading patterns:

TT Trade Surveillance Dashboard

When you log in to TT Trade Surveillance, you’ll land on the TT Trade Surveillance dashboard page. The dashboard provides an interface for using TT Trade Surveillance functionality as shown.

The dashboard includes:

TT Trade Surveillance Dashboard: Models at a Glance

Clusters are displayed with only the previous day’s trading activity by default. Click View to open the Surveillance page and view the Cluster List for the selected model or click View/Filter All Score Data to open the Surveillance page and view data for all models, products, and filters.

TT Trade Surveillance Dashboard: Cases

Hover on a status in the chart to display the percentage of investigations with that status. Click view all to go to the Cases page.

TT Trade Surveillance Dashboard: 30 Day Trends

Click Data Set to show risk trends for one or more models or all models combined. You can also hover on a data point to display the cluster scores on that particular date.

TT Trade Surveillance Dashboard: Alerts

This section displays triggered alerts based on the Date Range you select. Click View Clusters to go the Alerts page and display the clusters that triggered the alert, or click view all to go to the Alerts page and show all alerts created by your company.

TT Trade Surveillance Dashboard: Reports

This section allows you to select and generate new reports from the dashboard. You can hover on the displayed report parameters to show the details. Click view all to go to the Reports page and show all reports generated by your company.

TT Trade Surveillance Preferences

The Preferences tab is available on the TT Trade Surveillance Dashboard and allows you to specify how cluster data is displayed for surveillance models, manage company preferences, and configure cross product monitoring.

User Preferences:

Under User Preferences, you can tailor the New Feed, set timezone preferences, and select whether you want to show the cluster stats for configurable models.

New Feed

Common

Company Preferences:

This section is only visible to TT Trade Surveillance Admins and allows them to set company wide preferences. These include switching SLAs on/off and managing Tags and Predefined comments.

Show SLA: This toggle allows administrators to turn SLAs on/off. When toggled on, this shows the number of clusters that have breached the SLA (default 24 hours) in the New Feed page:

Tags

This section allows administrators to manage Tags. Tags can be used for both Cases or Clusters and are a useful tool to help categorize the same. They can be used to quick search or filter for certain items and are helpful in day to day workflows.

Predefined Comments

This section allows administrators to manage Predefined Comments. Predefined comments are snippets of text that can be saved and used during adding comments on Clusters and Cases. It helps maintain consistency and saves time for analysts managing the clusters.

Cross Product Preferences

You can easily create product combinations in the Preferences section of TT Trade Surveillance. The Cross Products functionality supports product combinations across multiple exchanges.

Privacy Overview

This website uses cookies so that we can provide you with the best user experience possible. Cookie information is stored in your browser and performs functions such as recognising you when you return to our website and helping our team to understand which sections of the website you find most interesting and useful.

Strictly Necessary Cookies

Strictly Necessary Cookie should be enabled at all times so that we can save your preferences for cookie settings.

Analytics

This website uses Google Analytics to collect anonymous information such as the number of visitors to the site, and the most popular pages.

Keeping this cookie enabled helps us to improve our website.

Marketing

This website uses the following additional cookies:

(List the cookies that you are using on the website here.)